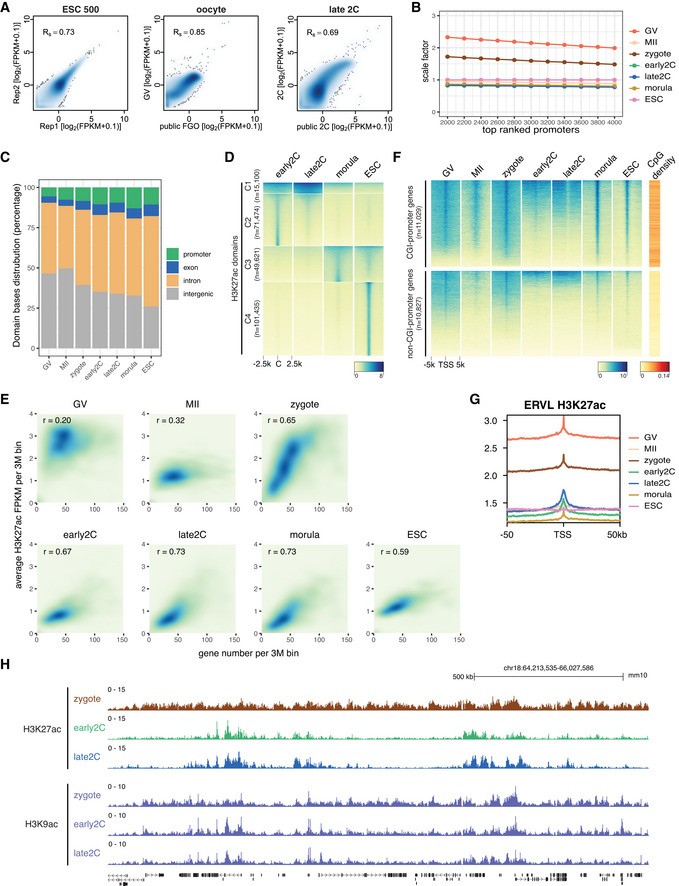
Figure EV1. Dynamics of H3K27ac in mouse oocytes and early embryos.

- Spearman correlation of H3K27ac CUT&RUN replicates and correlation with available public data. The public H3K27ac data were generated using the μChIP–seq method (Dahl et al, 2016). GV—germinal vesicle oocyte; FGO—fully grown oocyte; 2C—2‐cell embryo.
- Scale factors for H3K27ac FPKM at different stages. The scale factors at top 3,000 promoters were used.
- H3K27ac domain bases distribution at promoter, exon, intron, and intergenic regions for each stage.
- Dynamic changes of H3K27ac from early 2‐cell to morula stage and ESC. C: domain center.
- Correlations between gene density and H3K27ac signals for each stage.
- H3K27ac signal enrichment around TSS of genes with CGI or non‐CGI promoters. CGI: CpG island.
- Enrichment of H3K27ac at ERVL retrotransposons at different stages.
- Genome browser view showing different dynamics of H3K27ac and H3K9ac from zygotes to late 2‐cell embryos.
