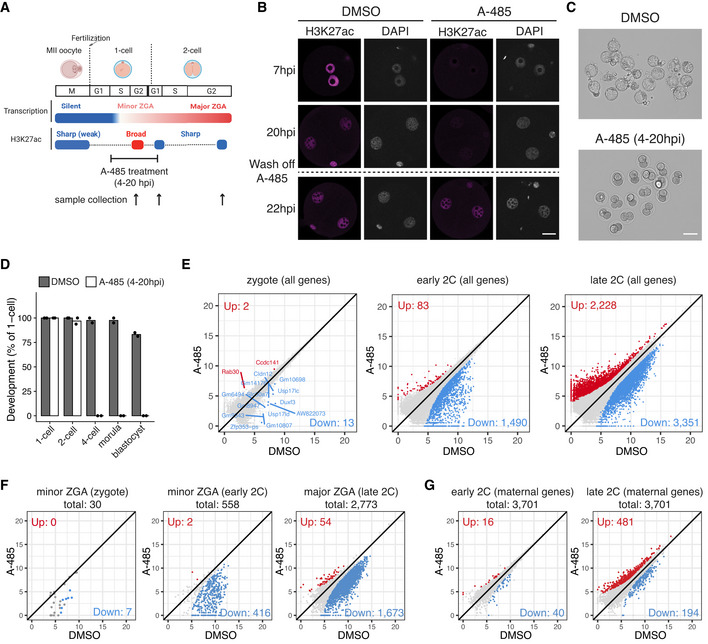
Figure 4. CBP/p300 inhibition in zygotes leads to H3K27ac loss, ZGA failure, and development arrest.

- Schematic illustration of transient CBP/p300 inhibition from zygote to early 2‐cell with A‐485. The cell cycle stages were based on (Abe et al, 2018). The arrows indicate the time points of sample collection for RNA‐seq.
- Immunostaining of H3K27ac in A‐485‐treated embryos versus control (DMSO‐treated) at different time points. Scale bar: 20 μm.
- Images of embryos treated with DMSO (control) and A‐485 at 96 hpi. Scale bar: 80 μm.
- Developmental rate of embryos treated with A‐485 versus control.
- Scatter plots showing the whole transcriptome changes in zygotes, early 2‐cell, and late 2‐cell embryos after CBP/p300 inhibition.
- Scatter plots showing the expression level changes of zygote minor ZGA genes (n = 30), early 2‐cell minor ZGA genes (n = 558), and major ZGA genes (n = 2,773) after CBP/p300 inhibition.
- Scatter plot showing the expression level changes of maternal decay genes (n = 3,701) in early 2‐cell and late 2‐cell embryos after CBP/p300 inhibition.
