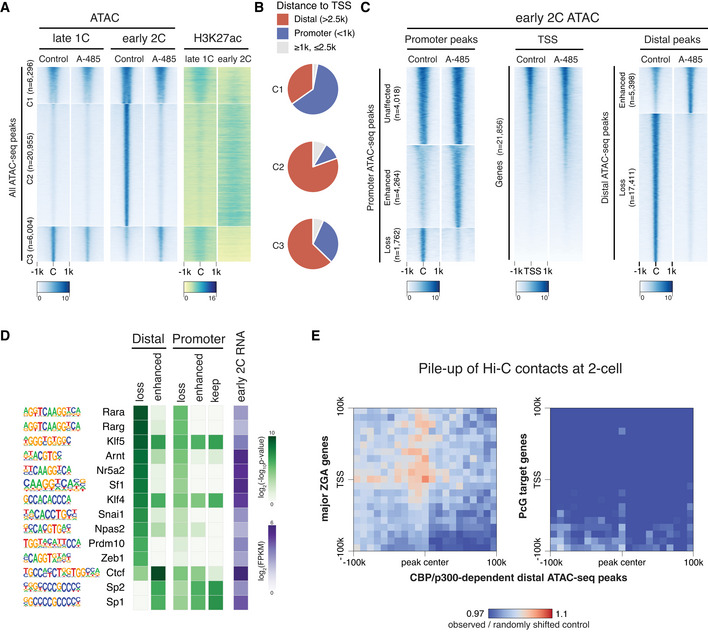
Figure 5. CBP/p300 inhibition affects chromatin opening of putative enhancers at early 2‐cell stage.

- Heatmap showing ATAC‐seq signals at late 1‐cell and early 2‐cell under control and A‐485‐treated conditions, and the corresponding H3K27ac signals at these ATAC‐seq peaks. All the ATAC‐seq peaks were classified into three groups based on the changes from late 1‐cell to early 2‐cell in control condition. C1—keep open from late 1‐cell to early 2‐cell; C2—newly opened at early 2‐cell; C3—reduced opening at early 2‐cell.
- Ratio of distal ATAC‐seq peaks (>2.5 kb to TSS) and promoter ATAC‐seq peaks (<1 kb to TSS) in group C1‐3 of panel A.
- Heatmap showing the impact of CBP/p300 inhibition on chromatin openness of different regions (promoter, TSS and distal regions) at early 2‐cell stage.
- Transcription factor (TF) motif enrichment at distal and promoter ATAC‐seq peaks with different responses to CBP/p300 inhibition. Only TFs with expression level of FPKM≥5 at early 2‐cell stage were considered.
- Pile‐up of Hi‐C contacts at 2‐cell stage between CBP/p300‐dependent distal ATAC‐seq peaks (x‐axis) and major ZGA genes TSS regions (y‐axis, left panel). The same analysis was also performed between CBP/p300‐dependent distal ATAC‐seq peaks and PcG target genes TSS (right panel) as a control.
