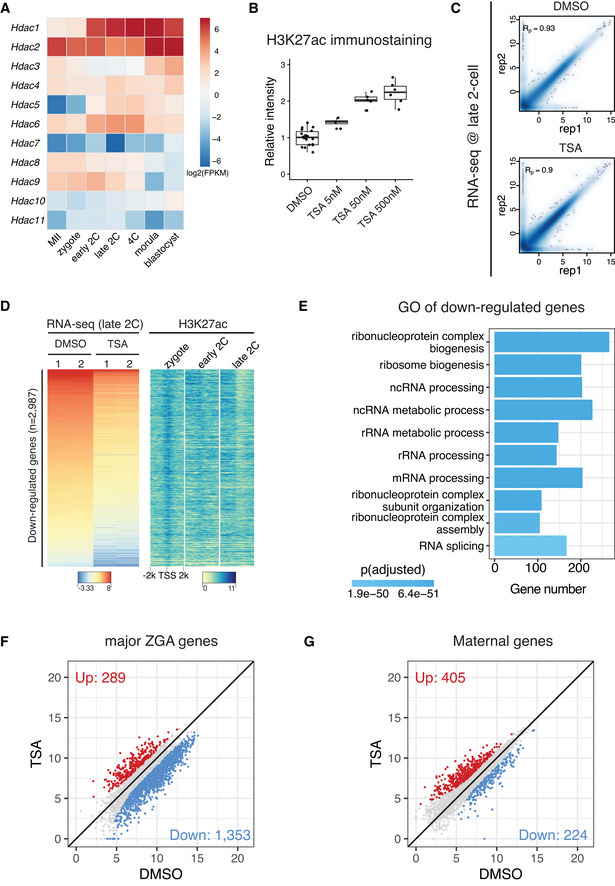
Figure EV5. Transcriptome comparison of HDAC inhibition versus control.

- Expression dynamics of HDAC genes in mouse MII oocyte and preimplantation embryos.
- Immunostaining quantification of H3K27ac relative intensities in Fig 6B (4–16 biological replicates in each condition).
- Pearson correlation of RNA‐seq replicates at late 2‐cell stage for control (DMSO‐treated) and HDAC inhibition (TSA‐treated).
- Heatmap showing the down‐regulated genes after TSA treatment in late 2‐cell embryos and the corresponding H3K27ac dynamics at the promoters of these down‐regulated genes.
- Gene Ontology (GO) enrichment analysis of the down‐regulated genes after HDAC inhibition.
- Scatter plot showing the impact of HDAC inhibition on expression levels of major ZGA genes.
- Scatter plot showing the impact of HDAC inhibition on expression levels of maternal decay genes.
Data information: For boxplots in (B), the central band represents the median. The lower and upper edges of the box represent the first and third quartiles, respectively. The whiskers of the boxplot extend to 1.5 times interquartile range (IQR).
