
Figure 3. CapH oligomerization is required for DNA binding.
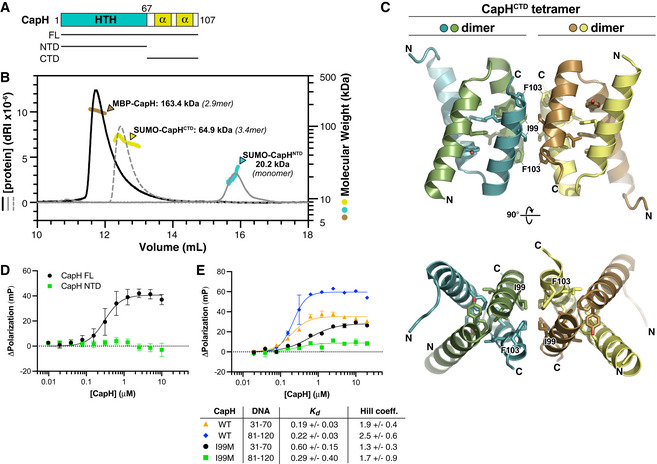
- Domain schematic of E. coli MS115‐1 CapH, showing the truncations used for oligomeric state determination.
- Size exclusion chromatography coupled to multi‐angle light scattering (SEC‐MALS) determination of CapH oligomeric state. For each construct, measured molecular weight and inferred oligomer are indicated. MBP‐fused full‐length CapH (monomer MW = 57.0 kDa) is shown in brown; SUMO‐fused CapHCTD (monomer MW = 19.1 kDa) is yellow, and SUMO‐fused CapHNTD (monomer MW = 22.0 kDa) is cyan. See Appendix Fig S1A for SEC‐MALS analysis of untagged CapH.
- Crystal structure of the CapHCTD homotetramer. Residues comprising the hydrophobic core of each dimer (Phe81, Tyr85, Leu96, and Leu100) are shown as sticks, and residues comprising the hydrophobic tetramerization interface (Ile99 and Phe103) are shown as sticks and labeled. See Appendix Fig S1B for structure of the CapHCTD(I99M) homodimer.
- Fluorescence polarization assay showing binding of E. coli MS115‐1 CapH (His6‐MBP tagged; full‐length [black circles] or NTD [green squares]) to the Site 2 DNA. WT K d = 0.30 ± 0.08 μM, Hill coefficient = 2.0 ± 0.7; no binding detected for CapHNTD. Error bars indicate standard deviation from three technical replicates.
- Fluorescence polarization assay showing binding of E. coli MS115‐1 CapH (His6‐MBP tagged) to the Site 1 (bases 31–70) and Site 2 (bases 81–120) DNAs. Wild‐type CapH binding Site 1 is shown in orange triangles, and binding Site 2 is shown in blue diamonds. CapH(I99M) binding Site 1 is shown in black circles, and binding Site 2 is shown in green squares. Fit K d and Hill coefficient for each combination is shown. See Appendix Fig S1C for EMSA analysis of CapH WT and I99M binding to the Site 2 DNA. Error bars indicate standard deviation from three technical replicates.
Source data are available online for this figure.