

Abstract
Metallic glass (MG), an intrinsic heterogeneous structure at the atomic scale, is one of the promising engineering materials with intriguing physical properties. MG often suffers from the fatigue issue caused by the repetitive mechanical loading, but it is still elusive how the local heterogeneity evolves and affects the macroscale fatigue and deformation against bulky external stress. In this study, we investigate the fatigue effect in Zr–Cu–Al ribbon using a bending fatigue method. We used scanning probe microscopy (SPM) in parallel with X-ray diffraction and X-ray photoelectron spectroscopy to figure out the loading effect on the local heterogeneities. The spatially resolved SPM images show that there is a local fluctuation of mechanical and electrical properties on the fatigued side along with morphological deformation compared to the unloaded side. Approaching the broken edge where the fatigue failure occurs, the decaying tendency is not only more dominant but also accelerated by surface oxidation of the fatigued regions. Our study provides a useful guideline on how to monitor structural changes of MGs under fatigue conditions in service and will open a door toward commercialization of high-performance structural engineering materials.
1. Introduction
Metallic glass (MG) with an amorphous structure has ideally no crystallographic defects, which allows for various superb properties, such as high hardness, large elastic limit, small wear resistance, and high fracture toughness.1−5 Among various MG groups, Zr–Cu-based MGs have structural configurations of weakly interacting atoms, enabling to monotonically change various properties in a wide composition range without either significantly altering the atomic arrangement or inducing the phase-shift at a particular composition ratio. Because the behavior is roughly predictable by exchanging the composition ratio of Zr and Cu atoms within the wide range, the Zr–Cu-based BMG is considered as an appropriate model system for the study of solid-solution properties of BMG.6−9 In addition, such superior engineering properties as high strength,1−3 reasonable plasticity,10 and high glass-forming ability make it an archetypical BMG system.
Nevertheless, the MG is vulnerable to repetitive macroscale loading (fatigue),11 and its fatigue limit to the yield strength spanned a very wide range from 4% even to 50%,12−14 depending on external factors, such as composition, defect density, chemical environment, surface condition, temperature, loading frequency, mean/residual stress, and so on.15 This is in contrast to the fact that the fatigue limits of conventional crystals are generally as large as ∼40% of their tensile strengths.16 In addition, because the fatigue limit was recently reported to be closely related to shear band behavior, researchers began to find ways to prevent the shear formation for increasing the limit.17
However, there is still a lack of understanding about the initiation mechanisms of fatigue crack and shear band. Although it has been predicted that irreversible local structural changes continuously occur under fatigue-loading conditions, sudden changes of properties at the local scale often hinder in-depth study. To systematically track down such changes, it is necessary to distinguish the inhomogeneous local states which are otherwise averaged out over a large length scale. As their length scale can span from the atom/nanoscale through the meso/macroscale, some cooperative experimental protocols are required to explore the correlations between the characteristics of different length scales. Furthermore, there have been a limited number of studies for the ambient condition effects, such as air and moisture, on mechanical properties. If ever, corrosive solutions of NaCl and HCl were mainly used for the environmental study with bulky characterization.18−20
In this study, using a flex tester, a series of bending fatigue stresses were provided to the Zr–Cu–Al system (Zr50Cu40Al10), until the failure was detected by current/voltage behavior. Then, the surfaces of both the fatigued side and the as-spun one were systemically compared to evaluate the degradation of mechanical/electrical/chemical surface properties caused by the fatigue load. After failure, the surface-sensitive and spatially resolved scanning probe microscopy (SPM) was mainly used in characterizing the surface properties of the MG together with X-ray photoelectron spectroscopy (XPS). Especially, in contrast to scanning electron microscopy, our SPM study was capable of providing mechanical and electrical information together with the corresponding structure in a more quantitative way.
2. Experimental Methods
2.1. Sample Preparation
The ingot of Zr50Cu40Al10 alloy was prepared in a plasma-arc-melting furnace from a mixture of high-purity elements (Zr (>99.9%), Cu (>99.99%), Al (>99.99%) under a Ti-gettered argon atmosphere. Prior to the arc-plasma induction, a high vacuum state (<10–5 Torr) was maintained. For alloying, the furnace was filled with an Ar atmosphere of ∼400 Torr. The ingot was re-melted more than five times for compositional homogeneity, and each re-melting process was completed within a minute. A rapidly solidified ribbon was quickly prepared by the melt-spinning technique. The alloy ingot was re-melted in a quartz tube of the induction heater and ejected at an over-pressure of 50 kPa through a circular nozzle of 0.5 mm in diameter into a copper wheel (rotating at a surface velocity of 40 m/s). The geometry dimension of the as-spun ribbons was 2 ± 0.2 mm(width) × 50 ± 5 μm (thickness), and the length is controllable. The following preliminary checks like X-ray diffraction and scanning electron microscopy (SEM) with energy-dispersive spectroscopy assured us that the sample is fabricated as we expected (Figure S1).
2.2. Cyclic Bending Test
Fatigue tests of ribbon samples were conducted by a custom-made apparatus with a pair of parallel plates. As shown in the left side of Figure S2, each edge of the ribbon was firmly fixed on both plates of the tester and bent by the decrease of the gap between two plates. Because the size of the fatigue damaged zone is known to be proportional to the relative displacement and the bending radius in the bending test, we tuned the two factors to control the fatigue size. Especially, it was reported that the fatigue damaged area size was roughly proportional to the linear displacement21,22 We set the length of ribbons to 6 cm, and the gap between plates is precisely controlled down in the micrometer scale.
To continuously provide fatigue damage in the sample, the lower plate was moved in a reciprocating motion with a linear displacement of 5 mm, while the upper plate was fixed. The cyclic frequency of 1 Hz was set to minimize thermal side-effects. Assuming that the entire curved area is bent with the same curvature in response to the gap between two plates, surface strain (ε) was estimated as follows:
| 1 |
where t and d are the thickness of the ribbon and the gap between two plates, respectively. Taking the sample geometry into account, it was estimated that the nominal bend strain of ∼1.05% was applied in the curved area.21 Because the electrical properties of the ribbon are influenced by the fatigue as well, we carefully observed the electrical resistance change of metal ribbon in the real-time, while repeating the bending cycle motions.
2.3. High-Energy X-ray Scattering
The
atomic structure of the melt-spun Zr50Cu40Al10 ribbon was investigated by X-ray scattering (XRS) at the
5A beamline of the Pohang Light Source (PLS-II, 3.0 GeV, Pohang, Korea)
with a wavelength of 0.6927 Å (equivalent to ∼17.8 keV)
through transmission mode. The beam size of X-rays is ∼2.0
mm × ∼1.0 mm. The scattering intensity was measured as
a function of detector angle and azimuthally integrated. After being
corrected and normalized for the scattering factors (spatial distortion,
air scattering, polarization, absorption, Compton scattering, etc.),23 the raw data were converted to a structure function, S(Q) ( , where λ is the wavelength).
Then,
the pair distribution function (PDF, g(r)) was derived as a function of atomic-pair distance (r) by the Fourier transformation of S(Q) as follows:24
, where λ is the wavelength).
Then,
the pair distribution function (PDF, g(r)) was derived as a function of atomic-pair distance (r) by the Fourier transformation of S(Q) as follows:24
| 2 |
where ρ0 is the mean atomic density, defined as NAVσ/m (NAV: Avogadro number, σ: mass density, m: average atomic mass). From eq 2, the radial distribution function RDF(r) was calculated as:25
| 3 |
The coordination number (CN) of the MG was derived by integrating the first radial distribution function RDF(r) maximum.
2.4. Pinpoint-Mode SPM
SPM (NX-10, Park Systems) was used to characterize mechanical properties of the Zr50Cu40Al10 alloy with the pinpoint mode. The SPM cantilever repetitively performs the approaching/lifting motion at every pixel of the scan area to acquire a force–distance (F–D) spectrum. Then, the cantilever jumps to the next pixel. The topography information was collected by keeping a preset peak force of 180 nN. The Z-piezo travel distance was set to 50 nm. In F–D measurements, the adhesion force (Fa) is defined as a force that pulls the tip off the surface. The energy dissipation (Ediss) and deformation (Δd) are defined as the area difference between the loading and unloading curves and the distance between the contact point and the turn-away point, respectively. (Figure S3) According to the modified Hertzian model,26 the reduced modulus (E*) was calculated from the slope of the unloading curve using the following equation:
| 4 |
where R and FL are the tip radius and loading force. E* can be defined as:
| 5 |
where Es (Et) and νs (νt) are the elastic modulus and Poisson’s ratio of the sample (tip), respectively. νs and νt were estimated to be 0.3.27 Note that a diamond-coated tip with high stiffness (Et = 1050 GPa, k = 40 N/m, Micro Star Technologies) was employed to minimize the tip effect. For more quantitative analysis, the indentation radius of the tip was calibrated to be 4 nm by correcting the measured E* (Figure S4) on the basis of the well-known modulus of SiO2 (∼72 GPa).28,29 Finally, Es was extracted from the measured value of E* using eq 5.
2.5. Kelvin Probe Force Microscopy (KPFM)
The contact potential difference (CPD) between the tip and sample surface was measured by using KPFM. We used an Au-coated SPM tip (PPP-NCSTAu, k ∼ 7.5 N/m). While capturing a topography image, the CPD image was simultaneously taken with AC modulation of 1 V at 20 kHz. The work function of the sample (ϕs) was calculated from the measured CPD using the following equation:
| 6 |
where e is the elementary charge. The work function of the tip (ϕtip) was calibrated using an Au-coated substrate.30
2.6. X-ray Photoelectron Spectroscopy
XPS spectra were taken using a Thermo VG Scientific K-α system equipped with an Al Kα-ray source (1486.3 eV) in ultrahigh vacuum conditions. A 100 W X-ray spot of ∼800 × 800 μm2 was used for surface scans with a pass energy of 50 eV. Energy positions of core level peaks were calibrated by fixing the binding energy of C1s at 284.5 eV, and the Shirley-type background was subtracted for fitting of peaks. Owing to the good conductance of the specimen, XPS measurement was not influenced by the surface charging effect.
3. Results and Discussion
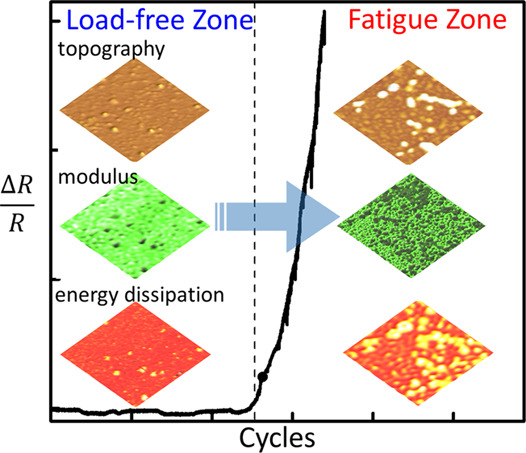
Using the cyclic bending tester, fatigue damage was induced in the ribbon of the Zr50Cu40Al10 alloy as described previously. While repeating the lateral motion, the resistance of the sample was continuously monitored. Because the resistance change caused by the background noise is below ∼0.5%, the threshold cycle number to create fatigue cracks was set as the moment when the resistance increased by ∼1%. (Figure S5) As the cycle number increased over ∼104, the relative resistance ratio increased exponentially up to ∼1.3 × 10⁴ cycles, where the ribbon was broken and failed. Such a drastic increase of resistance is attributed to the fatigue-induced defects (i.e., formation of excess free volume or cracks) and their propagation during the repetitive folding/unfolding process.21,31
To evaluate the fatigue-damage to the local atomic structure, high-energy synchrotron XRS was carried out at ambient pressure and at room temperature. After the structure function, S(Q) was acquired from XRS results (Figure S6), we converted it to a PDF function by following the eq 2. Considering the geometry of the flex bending system, the total fatigue-damaged area was speculated to be slightly shorter than a few-mm-scale along the longitudinal direction, comparable to the lateral displacement of the instrument.21 Because the beam spot size of XRS is the mm scale as well, only the two edges of the ribbon along the longitudinal direction (that is, the as-spun and the fatigued sides) can yield a reliable difference. As depicted in Figure 1a, the PDF spectra of both edges showed a strong correlation among the nearest pairs that are quickly weakened with increasing distance (r). Such depressed correlation at large r suggests that both sides maintain a similar amorphous state without a long-range crystallinity. Although there is no remarkable change of the atomic structure in the medium-range (∼10 Å) of the PDF(r), we observed a small difference in the 1st-NN shell peak, corresponding to the short-range (<4 Å). The inset of Figure 1a shows the enlarged 1st-NN shell region, where the maximum peak position of the fatigued region in the 1st-NN shell slightly shifts to a higher r-value by ∼2 Å, compared with the as-spun region. This indicates that the 1st-NN shell in the fatigued region is radially expanded by ∼0.7% in reference to the as-spun region. Accordingly, the atomic coordination number (CN) of the as-spun and the fatigued regions was estimated as ∼13.5 and ∼13.3, respectively, by calculating the 1st-NN shell area through integration of eq 3. The increased radius and the decreased CN in the fatigued region reflect that the atomic structure was swelled by generating the free volume or defects during the fatigue loading. Because the PDF curves consist of available atomic pairs, they were deconvoluted while considering the nominal compositions and the Goldschmidt radius (RZr = 1.60 Å, RCu = 1.28 Å, RAl = 1.43 Å).8 As indicated in Figure 1b,c, the decent fitting results were obtained by three Gaussian peaks. We attributed the first-(green), second-(blue), and third-(cyan) subpeaks to the atomic pairs of (i) Cu–Cu and Cu–Al, (ii) Cu–Zr, and (iii) Zr–Al and Zr–Zr, respectively. The Al–Al bonding was neglected because of the small content of Al. The second and third subpeaks centered at ∼2.90 and ∼3.24 Å for the as-spun side were moved to ∼2.92 and ∼3.28 Å for the fatigued side, respectively. This indicates that Zr-based amorphous structures were mainly slackened while generating numerous defects, such as free volume and shear bands in the sample. On the contrary, the first-subpeak corresponding to Cu–Cu or Cu–Al showed no shift, implying the negligibly small change of the related structures.
Figure 1.
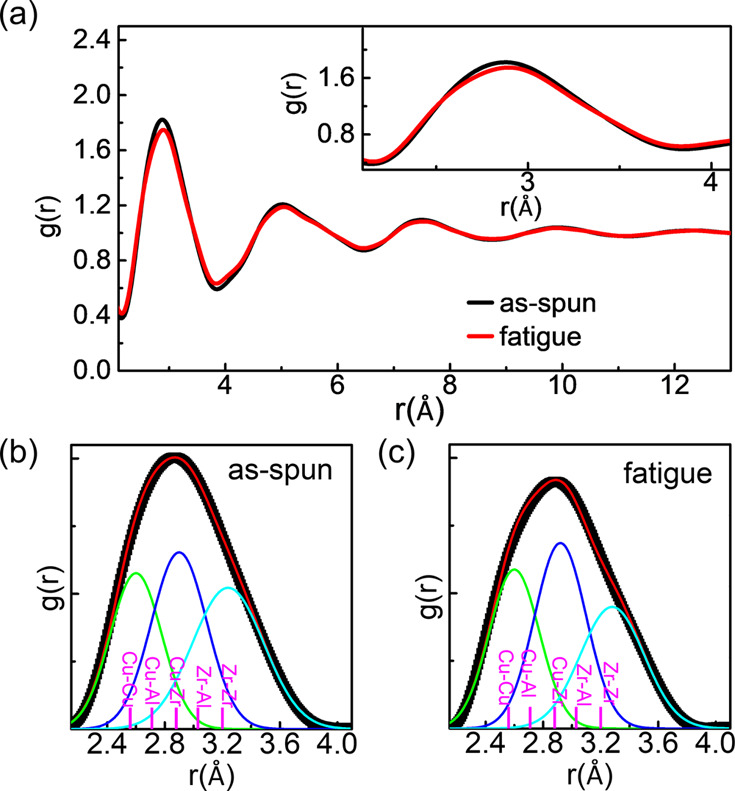
(a) PDF curves in the as-spun (black) and fatigued (red) sides of Zr50Cu40Al10 MG ribbon. No significant differences between the two sides were found in the long-range ordering part, but small changes in the short range-ordering (within ∼6 Å): the inset enlarged the difference in the first nearest neighboring (1st-NN) shell. Gaussian fitting of the 1st-NN PDF peak for (b) as-spun and (c) fatigued side: The black and the red curves correspond to the raw data and the total summation of the deconvolution curves, respectively.
Because the mechanical properties of MGs are governed by the bonding configurations among the atomic clusters, it is crucial to directly probe the mechanical properties of the small regions with a measurement tool with high spatial resolution. In this regard, we employed the pinpoint SPM. With respect to the mechanical loading effect, we first checked if there are any discernable morphological changes in the nanoscale. In Figure 2a, the 2 × 2 μm2-topography images were provided over the as-spun (top) and the fatigued areas (bottom) (denoted as AAS and AFTG, respectively). From the topographic images, the height distribution (Figure 2b) and the apparent mean radius (Figure 2c) were calculated. As indicated in the figures, on the contrary to the relatively smooth surface of AAS, AFTG became seriously rugged due to the appearance of multiple nanograins whose size is in a broad range from several tens of nm to over-100 nm. To quantitatively evaluate the surface corrugation, the surface roughness value, Rq, is decided by the root mean square average of the height profiles over the distance. Rq for AAS and AAS was measured to be ∼0.71 and ∼ 3.35 nm, respectively, as shown in the inset of Figure 2b. Meanwhile, the coverage of protruded regions and the mean radius in AFTG increased to ∼30% and ∼34 nm, respectively, in reference to AAS with at most ∼14% and ∼27 nm. Interestingly, the bulges in AFTG are divided into two different shapes: (i) the mount-like one and (ii) the even elliptical plate-like one (indicated as a and b in Figure S7a, respectively); meanwhile, the AAS showed only the small mount types.
Figure 2.

(a) SPM topographies in the as-spun (top) and fatigued (bottom) sides of the sample. (b) Height distribution curves in (black) the as-spun and (red) fatigued sides: (inset) RMS roughness values in the two sides. (c) Mean radius distribution of protrusions in (black) the as-spun and (red) fatigued sides. (d) F–D curves measured on (black) the as-spun side, (red) the bulge, and (green) the flat region of the fatigued side, respectively. (e) Force slopes in the repulsive regime during the loading process of FD curves in (d). (f) Integration of force difference between the loading and unloading processes with respect to the travel distance of the probe, which corresponds to the dissipated energy.
To investigate the mechanical features in the AAS and AFTG, F–D spectroscopy was conducted. We suggest the representative F−D-curves on AAS and the bulged and flat regions of AFTG (denoted as AFTG(b) and AFTG(f), respectively) in Figure 2d. The spaces among the curves were intentionally adjusted along the X-axis for better clarification. Also, Figure 2e,f individually shows the slope of the tangential region and the integration over the hysteresis caused by the discrepancy between the contact/retract processes for the three different sites, which indicate the elastic modulus and the dissipated energy, respectively. In opposite to the linear slopes in the repulsive regime that decreased in the order of AAS > AFTG(f) > AFTG(b), the hysteresis areas increased along with the order of AAS < AFTG(f) < AFTG(b). The relations are attributed to the loosely packed atomic packing in the fatigued side, which is consistent with the XRS results. In addition, as shown in Figure 2e, AAS showed higher energy dissipation in the attractive force regime (20 nm < Δz < 30 nm) as well as in the repulsive force regime (30 nm < Δz < 40 nm) other than the other two regions, where Δz is the travel distance from the disengaged tip position. This means that the AFTG(b) is not only mechanically softer, but also more chemically attractive than other sites.
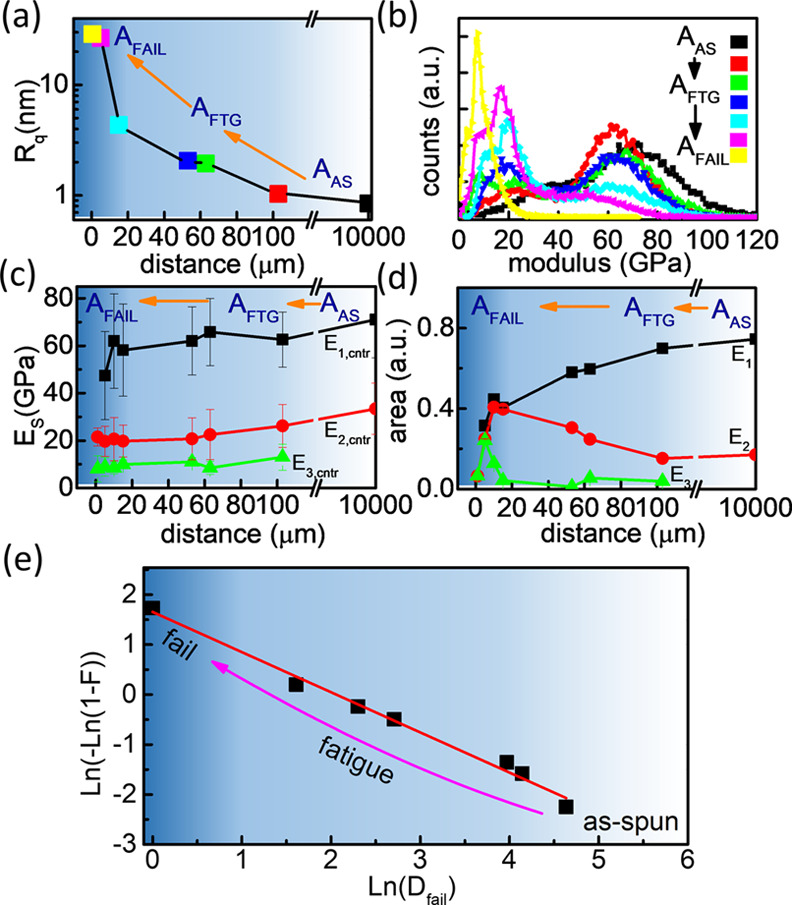
Next, while systemically shifting the local probing position from AAS to the fracture/failure area (AFAIL) across AFTG, the surface topography was measured with the pinpoint SPM in which F–D spectroscopy was simultaneously performed at every topography pixel. In such a way, we achieved the spatial distributions of adhesion force (Fadh), energy dissipation (Ediss), and deformation (Δd), allowing for the quantitative and statistical analyses of mechanical properties. The elastic modulus (ES) of the sample was extracted from the slope of the F–D curve by using eq 4 and eq 5. To gauge the distance from the failure edge as precisely as possible, the step motor and the piezo-scanner of SPM were utilized for XY-shift in large scale of >10 μm and in small scale of <10 μm, respectively. Figure 3 shows the representative maps of topography, ES, Ediss, Δd, and Fa, at the first-, second-, third-, and fourth-row images, respectively. The first/second/third column images individually correspond to AAS, AFTG, and AFail, which were taken away from the failure edge by ∼10,000/15/5 μm, respectively. Figure S8 shows the additional image sets obtained at more diverse locations. The scan area was 2 × 2 μm2, and the peak force was kept constant at 180 nN using a feedback loop. From the series of topography, we plotted the surface roughness variation as a function of the distance from the failure edge (Dfail) as shown in Figure 4a. In Figure 3, AAS (the first-column images) exhibited high ES (∼70 GPa) and low values of Δd (∼1 nm), Ediss (∼1 fJ), and Fa (∼20 nN), along with small Rq (∼0.845 nm). Their fluctuations were relatively small unless the probe approaches too close to the fracture-edge within the sub-mm scale. Only when Dfail was getting close to and less than a few hundred micrometers, sizable lumps began to occur on the surface sporadically. As previously shown in Figure 2a, while penetrating into AFTG deeper, more lumps proliferated quickly on topography, deteriorating the surface smoothness (Figures 3 and S8). We also suggested the 3D images about topography in Figure 3 for more convenient understanding (Figure S9).
Figure 3.

Pinpoint SPM images: the first-, second-, and third-columns correspond to the as-spun, the fatigued, and the failure areas, respectively. Near the failure areas, the shears band formed along with the high-density defects (where the lowest Es with the highest Ediss, Δd and Fa were populated) and a macroscaled crack grew along the direction perpendicular to the applied stress.
Figure 4.
(a) Roughness and (b) modulus distributions depending on different Dfail. To help one’s understanding, the color codes of (b) were matched to (a). (c) Center position and (d) area of subpeaks obtained from deconvolution of (b) are displayed as the function of Dfail. (e) Cumulative failure distribution as a function of Dfail: the red line represents the Weibull model. The shadow background was intentionally given to represent the fatigued states in (a), (c), (d), and (e).
Additionally, we matched the modulus and the height information simultaneously observed at the identical location, which made us assure that there exists a certain strong correlation between surface roughening and modulus (Figure S10). The figure indicates that the nanobulges induced the surface roughening while lowering the modulus. The trend became more prominent with the reduction of Dfail. Figure S11 indicates the size distributions of nanobulges in AFTG. The minimum detectable size is in the range of ∼1-nm height and ∼10 nm-radius.
Moreover, as shown in AFTG of Figure 3 (the second-column images), Es in the lumped structure substantially dropped below ∼30 GPa, while the values in the rest flat regions are still as good as or just slightly smaller than that in AAS. In AFail of Figure 3 (the third-column images), Rq suddenly surged up by an order of magnitude as the probe position approaches the failure edge where not only the number of bulges drastically increases, but the entire region also begins to undergo a significant plastic behavior. Consequently, the Es declined sharply, partially dropping even below ∼10 GPa.
Dfail-dependent ES distributions were suggested in Figure 4b. For more elaborate analysis, each curve was deconvoluted into three regimes of E1, E2, and E3 except for in AAS (where only the two E1 and E2-regimes were present.). The center value and the area of the fitted subpeaks were plotted in Figure 4c,d, respectively. As Dfail was getting close to zero across AFTG, the peak centers gradually downshifted. On the other hand, the areas of both E2 and E3 continuously increased at the expense of the E1 for the reduction of Dfail. Particularly, the expansion of the E3–regime was accelerated in the AFail. In general, the fatigue failure stages of MGs can be categorized as: (i) defect-induced plasticity, (ii) crack-initiation along the defect/plasticity, (iii) crack-propagation to macroscale, and (iv) fast propagation and fracture.15 Because such critical disfigurations tend to initiate around the surface due to the stress singularity,32 we inferred that Figure 3 describes the spatial distributions of localized defects and cracks at the nanoscale. Accordingly, it was thought that the increased roughness and the expansion of E2-and E3-domains are associated with the local plastic deformation led by various defects and nanocracks. Furthermore, the global modulus degradation in the deep AFTG and AFail can be interpreted as the activation of macroscale cracks, which is in agreement with the previous report obtained from the TEM study.33 Finally, the macroscaled shear fracture starts to progress along the direction roughly perpendicular to the loading stress, resulting in a striation-type fracture on the surface of the AFail. Because the growth of cracks and their linkages have been known to be retarded under the compressive stress, the distinct shear-off steps and their propagation normal to the loading direction suggest that the shear fractures were formed by a tensile stress.15,34 On the other hand, Δd, Fa, and Ediss increased exclusively on the bulged structures of AFTG with the decreasing Dfail during the early fatigue stage, maintaining similar levels in the rest flat regions to those of AAS. However, approaching AFail (the third-column images in Figure 3), all these values greatly increased along with the shear-off steps against the reduction of Es. This made it evident that the defects related to bond-breaking were accumulated along the narrow path, raising the local chemical activity and plasticity. Therefore, the crack prefers to initiate along an inelastic path, in turn, generating more defects and cracks through the adiabatic process. Moreover, the topography in the AFail is featured by a series of striation spacings with several-hundred-nm width. Because such a fine shear is caused by the successive crack propagation along with a single shear band, the width is approximately equivalent to the crack growth rate at every loading cycle.16,35,36 Although the coarse striation of μm-scale was also conceivable with the jump of cracks over to another shear band during the repetitive cycling load,34 it was challenging for SPM to track such a rough morphology change whose range is often over the Z-feedback scale (> ∼500 nm). The large-scale SPM topography and the cross-sectional SEM image were suggested so as to showcase the behaviors of crack/shear-off steps in the longitudinal/ transverse directions near the failure edge, respectively, (Figure S12).37
To gain a better perspective of the local stress effect, we assumed that our ribbon-type specimen is composed of numerous slice segments with an identical volume and cross-section along the length direction. We considered stress as an aging parameter whose magnitude remains constant inside a single segment but can vary smoothly through segments. Accordingly, the defect density was also predicted to be generated in a similar way. If the fatigue failure is governed by the critical defect density based on Weibull theory,38 a unit volume with the higher stress and higher defect density naturally decreases its critical defect density for failure. Therefore, failure can occur more easily even at the lower loading stress. Specifically at the nanoscale, because the total defect number for the failure/plasticity is restricted by the geometric size, the relation between stress and defect density can yield the following power-law-scaling:39−41
| 7 |
where σ, n, and V are stress, defect density, and the volume size of a unit segment. σref and nref are the critical stress and defect density to the failure/plasticity in a unit volume segment.
Analogously, it can be speculated that location-dependent critical defect density (Dref) also follows the power-law scaling of Dfail with a power factor (β) in our specimen41−43 Then, the failure probability can be formulated by
| 8 |
where F is the cumulative failure rate. Dref implies the critical distance where ∼63% of Es were degraded. Finally, eq 8 is rewritten in the linear form:
| 9 |
Then, we checked whether the degradation behavior in Es images (Figures 3 and S8) really follows the power-law dependence of location as speculated from the Weibull model. As the critical value for Es degradation was set as ∼63% of E1, both the total coverage areas of E2- and E3-regimes in the Es-maps could be regarded as the failure state. Using eq 9, ln(1 – ln(1 – F)) of the specimen is plotted versus the logarithm of Dfail. Indeed, Figure 4e indicates that the experimental failure rate (black square) follows the Weibull model (red line) well. By extracting the linear slope from the graph, β and Dref were found to be ∼0.803 and 7.831 μm, respectively, with a good correlation of R2 = 0.98. The amplitude of β reflects the size distribution of critical defects. That is, large β indicates that defects were of similar size so as to have the narrow fatigue life deviation. Also, Dref is the characteristic distance for modulus degradation to reach ∼63% of normal state.37 The result corroborates that the defect density to activate the plastic deformation is dependent on the distance from the failure edge with the power-law relation. Moreover, the fact that the overall range was able to be fitted with a single power factor indicated that the size and strength distributions of defects are unimodal, regardless of the increased defect density.41,44,45
Next, to explore the fatigue effect on the surface potential, KPFM was performed. Figure 5 shows topography (left) and CPD (right) maps which were taken at Dfail of ∼10,000/13/1 μm, corresponding to AAS (top), AFTG (middle), and AFAIL (bottom), respectively. The scan area was 2 × 2 μm2. We also presented the additional image sets for more diverse locations (Figure S13).
Figure 5.

(a) KPFM images: the first-, second-, and third-rows correspond to the as-spun, the fatigued, and the failure areas, respectively. (b) (top) Roughness and (bottom) CPD variations depending on different Dfail. Work function value (red) is plotted together with the corresponding CPD (black) in the bottom panel.
Analogous to Figure S9, 3D view of topography images in Figure 5 are suggested as well (Figure S14). From the image group, the variations of surface roughness and CPD were plotted as the function of Dfail in the top and the bottom panels of Figure 5b, respectively. To elucidate the CPD variation, the work function (Φ) was calculated from eq 6 and projected together with the corresponding CPD in the secondary Y-axis. Analogous to the topography images in the pinpoint SPM, the surface roughness has just presented the gradual rise in AFTG, before the shear occurs in AFAIL. Meanwhile, the CPD contrast was rarely changed until approaching near AFAIL. The ignorable CPD variation reflects the good screening effect of the metallic specimen. If ever, the degree of change is so little as to be easily buried by the background noise of KPFM (∼60 mV). Nevertheless, while getting close to AFAIL, the global CPD signal quickly increased by ∼0.15 V, which implied that the work function suddenly dropped near AFAIL. Such a falling of work function is ascribable to the shear bands generated in AFAIL along the numerous negative charges accumulated along the shear. Consistently, several literature studies46,47 reported that the dominant bond-breakings near the plastic yield point significantly drop the work function.48
Finally, we tried to explore the chemical states of metal ribbon modified by the fatigue loading. Especially, judging from the size of nanobulges, XPS was employed to probe the chemical states of surface modified by the fatigue damage. Considering the beam spot size of mm-scale, only the edge sides of the ribbon were explored like in the case of XRS. The core-level of Cu2p or Al2p on the two edges sides is displayed in Figure S15 where neither of them was significantly influenced by the fatigue-loading. On the contrary, Zr3d (top) and O1s (bottom) in Figure 6a revealed some appreciable changes: In reference to the as-spun side, the fatigue side shows considerable changes in the Zr3d spectrum which developed the spectral weight around ∼183 eV, while attenuating the weight around ∼179 eV. Compared to the as-spun region, O1s in the fatigued side exhibited a significant growth of weight in the range from ∼531 to ∼536 eV. Considering that the specimen was fabricated in the inert Ar-environment, O1s of the as-spun edge is predominantly attributable to the surface oxidation of constituent transition metals or the moisture effect.49 In general, the oxidation of Zr is more preferred to that of Cu at room temperature due to the distinction in the enthalpy of formation: ZrO2 (−1100.6 kJ/mol) < CuO (−157.3 kJ/mol).50,51 Despite its negative enthalpy of formation (−1675.7 kJ/mol), the unchanged core-level spectra of Al2p allowed us to speculate that the fatigue-promoted Al oxidation was insignificant because of the pretty minor amount of Al. The more detailed analysis was made with the deconvolution of Zr3d spectra (Figure 6b).52,53 The best fitting results were obtained for both the regions by locating the subpeak centers of Zr0, Zr1+, Zr2+, Zr3+, and Zr4+ individually at 179.0, 179.6, 180.5, and 182.7 eV. The doublet splitting of all components was held at 2.4 eV with an intensity ratio of 3:2.54 The fitting area ratio was displayed in Figure 6c. The fatigued edge showed a noticeable change of Zr-oxidation state compared with the as-spun one: Zr4+-states were primarily developed at the cost of metallic Zr0. Meanwhile, the presence of metastable states such as Zr1+ or Zr3+ was relatively trivial so that their changes were insignificant. Additionally, as shown in Figure 6d, the O1s spectrum could be also divided into four subpeaks, and their area ratios were given in Figure 6e. The subpeaks are attributable to the metal oxide (Me–O:∼530.9 eV), the oxygen vacancies (VO:∼532.3 eV), the hydroxide metal (Me–OH:∼533.2 eV), and the adsorbed oxygen (Oads:∼534.2 eV),53,55 respectively. Figure 6e revealed that all the oxide subpeaks considerably increased with the fatigue-loading. According to the literature, Zr tends to be less resistive to oxidation with the increase of its structural disordering.56 Thus, the most susceptible one for oxidation is likely to be the Zr-based MG where oxygen at the surface can inwardly diffuse toward Zr to form ZrO2.57 The XPS result convinces us that the nanobulges observed by SPM correspond to the oxide-nanoislands. Particularly, the oxidation kinetics of the Zr-based MG can be promoted by the free volume or defects generated during the fatigue-loading because they can offer extra room for oxygen to dissolve in MGs even at room temperature.49,58 In principle, such a diffusive growth rate should be retarded soon by the newly grown oxide layer, ending up with the ZrOx layer with a finite size and thickness. However, as the surface oxide layer is continuously perturbed by the cyclic loading stress, its destruction and construction would be repeated in turn. Thus, pretty loose surface oxide will be improvised, continuously offering some paths for additional dissolution of oxygen atoms along with the surface defects or cracks. As shown in Figure 6c,e, the process will create nonstoichiometric surface oxide with several different oxide states, leading to more loose atomic structures with a lower modulus than the as-spun. This explained why the dent-shaped nanocracks is difficult to be detected under ambient conditions, in comparison with the crack-induced nanobulges in Figure S11.
Figure 6.

(a) XPS Zr3d (top) and O1s (bottom) spectra. (b) Deconvolution of Zr3d in (top) as-spun and (bottom) fatigued side. (c) Subpeak area ratio of Zr3d in (b). (d) Deconvolution of O1s in (top) as-spun and (bottom) fatigued side. (e) Subpeak area ratio of O1s in (d).
We also remind readers of Figure S7 where the oxide nanoislands in AFTG showed more dispersive size distribution with the different shapes in comparison with AAS. Such a broad distribution strongly suggests that the oxide diffusion in AFTG was repetitively assisted by the sequential surface damages. To substantiate our argument, the regional diffusivity difference was evaluated. To simplify the oxidation growth behavior, we just consider the isotropic one-dimensional diffusion at the surface under a constant oxygen concentration. According to the diffusion equation, the concentration change of oxide nanoislands (Δn(r,t)) can be displayed as the error function (erfc) of radius (r) and time (t):59
| 10 |
where D and n0 are the diffusion coefficient and initial concentration, respectively. By fitting the radial distribution of Figure 2c to eq 10, D*t was deduced as ∼1.05 × 10⁻¹⁶ m2(∼1.50 × 10⁻¹⁶ m2) for AAS (AFTG), respectively (Figure S16). Considering that the fatigue testing time (∼3 h) was much shorter than the total exposure-time of the specimen (∼24 h), we could roughly estimate the D of AAS (AFTG) to be ∼1.2 × 10⁻²¹ m2/s (∼1.4 × 10⁻²⁰ m2/s), respectively. The result manifests that the oxidation diffusion in AFTG substantially increased over an order of magnitude along with the surface defects or cracks.
4. Conclusions
Altogether, our results elaborated on how the Zr-based MG can initiate and progress the fatigue-failure from atom/nanoscale to macroscale. In response to the cyclic loading process, we confirmed that the Zr-based MG slightly deforms and slacken its atomic bonding configurations via the repetitive gain/dissipation of strain energy. To discern the fatigue-induced mechanical and electrical alteration, we have applied two SPM-based techniques which enable us to assess various mechanical and electrical properties with the corresponding topography at high spatial resolution. The pinpoint SPM revealed that the less stiff and more energy dissipated and more chemically attractive nanobulges were generated with the decrement of Dfail. In contrast to the as-cast region with the smoothest surface, as the degree of fatigue load increased in the fatigue zone, the occurrence of nanobulges caused by nanocracks gradually becomes more frequent with the decrease of Dfail. Their size distribution becomes also more broadened against the decrease of Dfail. Finally, the shear step and macroscale cracks were nucleated and evolved nearly the failure edge. Accordingly, Rq showed a rapid jump over an order of magnitude. Therefore, Rq is varied by both nanobulges and macrocrack evolution. We also observed that failure-probability is linked to Dfail by a power-law relation, which showed the way how defect/crack is spatially distributed. Such defects or cracks not only deteriorated the mechanical stiffness but also reduced the work function of the sample surface near the failure edge. Additionally, the fatigue loading offered paths along which oxygen penetrates inside the bulk. Indeed, pretty fast oxygen diffusion was observed along the crack, whose misconfiguration will deteriorate the stiffness seriously. Accordingly, the nanobulges observed by AFM showed the reduced modulus in fatigue zone. Furthermore, such a modulus degradation tendency becomes more significant in the failure region. It is attributed to more nanobulges and macroscale cracks which are composed of loose oxygen-bindings. We believe that this study provides a protocol to evaluate the multilength scale correlation between the bulky cyclic stress and the atomic reconfiguration in MGs.
Acknowledgments
J.H.K. and G.H.L. were supported by Basic Science Research Program through the National Research Foundation of Korea funded by the Ministry of Science, ICT & Future Planning(NRF-2017R1A2B2006568), Creative-Pioneering Researchers Program through Seoul National University (21A20131912052), and 2018M3D1A1058793. G.H.Y., W.H.R., and E.S.P. were supported by Samsung Research Funding Center of Samsung Electronics under Project Number SRFC-MA1802-06.
Supporting Information Available
The Supporting Information is available free of charge at https://pubs.acs.org/doi/10.1021/acsomega.2c04930.
Figures S1–S16: XRD and EDS spectra; schematics of the bending fatigue test; principles of pinpoint SPM mode; the contact radius-calibration of SPM tip; the electrical resistance curve as a function of bending cycle numbers; structure function curves of samples; SPM topography comparison between the as-spun and the fatigued area; pinpoint SPM images at various Dfail: 3D topography images of Figure 3a; Dfail-dependent relation between modulus and height; topography and modulus distributions obtained in the fatigued region; large scaled SPM topography and SEM images in the crack-region; KPFM images at various Dfail: 3D topography images of Figure 5a: XPS core level spectra; and error function fitting to the radial distribution (PDF)
Author Contributions
⊥ J.H.K. and G.H.Y. contributed equally.
The authors declare no competing financial interest.
Supplementary Material
References
- Zhu Z.; Zhang H.; Sun W.; Ding B.; Hu Z. Processing of bulk metallic glasses with high strength and large compressive plasticity in Cu50Zr50. Scr. Mater. 2006, 54, 1145–1149. 10.1016/j.scriptamat.2005.11.063. [DOI] [Google Scholar]
- Hofmann D. C.; Duan G.; Johnson W. L. TEM study of structural evolution in a copper mold cast Cu46Zr54 bulk metallic glass. Scr. Mater. 2006, 54, 1117–1122. 10.1016/j.scriptamat.2005.11.065. [DOI] [Google Scholar]
- Das J.; Tang M. B.; Kim K. B.; Theissmann R.; Baier F.; Wang W. H.; Eckert J. “Work-hardenable” ductile bulk metallic glass. Phys. Rev. Lett. 2005, 94, 205501 10.1103/PhysRevLett.94.205501. [DOI] [PubMed] [Google Scholar]
- He Q.; Shang J. K.; Ma E.; Xu J. Crack-resistance curve of a Zr–Ti–Cu–Al bulk metallic glass with extraordinary fracture toughness. Acta Mater. 2012, 60, 4940–4949. 10.1016/j.actamat.2012.05.028. [DOI] [Google Scholar]
- Li Y.-C.; Zhang C.; Xing W.; Guo S.-F.; Liu L. Design of Fe-based bulk metallic glasses with improved wear resistance. ACS Appl. Mater. Interfaces 2018, 10, 43144–43155. 10.1021/acsami.8b11561. [DOI] [PubMed] [Google Scholar]
- Mattern N.; Schöps A.; Kühn U.; Acker J.; Khvostikova O.; Eckert J. Structural behavior of CuxZr100– x metallic glass (x= 35– 70). J. Non-Cryst. Solids 2008, 354, 1054–1060. 10.1016/j.jnoncrysol.2007.08.035. [DOI] [Google Scholar]
- Yu H.; Wang W.; Bai H. An electronic structure perspective on glass-forming ability in metallic glasses. Appl. Phys. Lett. 2010, 96, 081902 10.1063/1.3327337. [DOI] [Google Scholar]
- Georgarakis K.; Yavari A.; Louzguine-Luzgin D.; Antonowicz J.; Stoica M.; Li Y.; Satta M.; LeMoulec A.; Vaughan G.; Inoue A. Atomic structure of Zr–Cu glassy alloys and detection of deviations from ideal solution behavior with Al addition by x-ray diffraction using synchrotron light in transmission. Appl. Phys. Lett. 2009, 94, 191912. 10.1063/1.3136428. [DOI] [Google Scholar]
- Comby-Dassonneville S.; Venot T.; Borroto A.; Longin E.; der Loughian C.; Ter Ovanessian B.; Leroy M.-A.; Pierson J.-F.; Steyer P. ZrCuAg thin-film metallic glasses: toward biostatic durable advanced surfaces. ACS Appl. Mater. Interfaces 2021, 13, 17062–17074. 10.1021/acsami.1c01127. [DOI] [PubMed] [Google Scholar]
- Inoue A.; Zhang W.; Tsurui T.; Yavari A.; Greer A. Unusual room-temperature compressive plasticity in nanocrystal-toughened bulk copper-zirconium glass. Philos. Mag. Lett. 2005, 85, 221–237. 10.1080/09500830500197724. [DOI] [Google Scholar]
- Shao L.; Ketkaew J.; Gong P.; Zhao S.; Sohn S.; Bordeenithikasem P.; Datye A.; Mota R. M. O.; Liu N.; Kube S. A.; Liu Y.; Chen W.; Yao K.; Wu S.; Schroers J. Effect of chemical composition on the fracture toughness of bulk metallic glasses. Materialia 2020, 12, 100828 10.1016/j.mtla.2020.100828. [DOI] [Google Scholar]
- Gilbert C.; Schroeder V.; Ritchie R. Mechanisms for fracture and fatigue-crack propagation in a bulk metallic glass. Metall. Mater. Trans. A 1999, 30, 1739–1753. 10.1007/s11661-999-0173-y. [DOI] [Google Scholar]
- Wang G.; Liaw P.; Morrison M. Progress in studying the fatigue behavior of Zr-based bulk-metallic glasses and their composites. Intermetallics 2009, 17, 579–590. 10.1016/j.intermet.2009.01.017. [DOI] [Google Scholar]
- Wang G.; Liaw P. K. Bending-fatigue behavior of bulk metallic glasses and their composites. JOM 2010, 62, 25–33. 10.1007/s11837-010-0055-1. [DOI] [Google Scholar]
- Jia H.; Wang G.; Chen S.; Gao Y.; Li W.; Liaw P. K. Fatigue and fracture behavior of bulk metallic glasses and their composites. Prog. Mater. Sci. 2018, 98, 168–248. 10.1016/j.pmatsci.2018.07.002. [DOI] [Google Scholar]
- Schuh C. A.; Hufnagel T. C.; Ramamurty U. Mechanical behavior of amorphous alloys. Acta Mater. 2007, 55, 4067–4109. 10.1016/j.actamat.2007.01.052. [DOI] [Google Scholar]
- Wang X.; Qu R.; Wu S.; Zhu Z.; Zhang H.; Zhang Z. Improving fatigue property of metallic glass by tailoring the microstructure to suppress shear band formation. Materialia 2019, 7, 100407 10.1016/j.mtla.2019.100407. [DOI] [Google Scholar]
- Ritchie R.; Schroeder V.; Gilbert C. Fracture, fatigue and environmentally-assisted failure of a Zr-based bulk amorphous metal. Intermetallics 2000, 8, 469–475. 10.1016/S0966-9795(99)00155-7. [DOI] [Google Scholar]
- Schroeder V.; Gilbert C.; Ritchie R. Effect of aqueous environment on fatigue-crack propagation behavior in a Zr-based bulk amorphous metal∗. Scr. Mater. 1999, 40, 1057–1061. 10.1016/S1359-6462(99)00067-6. [DOI] [Google Scholar]
- Hamidah I.; Solehudin A.; Hamdani A.; Hasanah L.; Khairurrijal K.; Kurniawan T.; Mamat R.; Maryanti R.; Nandiyanto A. B. D.; Hammouti B. Corrosion of copper alloys in KOH, NaOH, NaCl, and HCl electrolyte solutions and its impact to the mechanical properties. Alex. Eng. J. 2021, 60, 2235–2243. 10.1016/j.aej.2020.12.027. [DOI] [Google Scholar]
- Kim B.-J.; Jung S.-Y.; Cho Y.; Kraft O.; Choi I.-S.; Joo Y.-C. Crack nucleation during mechanical fatigue in thin metal films on flexible substrates. Acta Mater. 2013, 61, 3473–3481. 10.1016/j.actamat.2013.02.041. [DOI] [Google Scholar]
- Kim T.-W.; Lee J.-S.; Kim Y.-C.; Joo Y.-C.; Kim B.-J. Bending strain and bending fatigue lifetime of flexible metal electrodes on polymer substrates. Materials 2019, 12, 2490. 10.3390/ma12152490. [DOI] [PMC free article] [PubMed] [Google Scholar]
- Wagner C. Direct methods for the determination of atomic-scale structure of amorphous solids (X-ray, electron, and neutron scattering). J. Non-Cryst. Solids 1978, 31, 1–40. 10.1016/0022-3093(78)90097-2. [DOI] [Google Scholar]
- Lee J. S.; Oh H. S.; Kim W.; Ryu C. W.; Kim J. Y.; Chang H. J.; Gu J.; Yao K.; Murty B.; Park E. S. Anomalous behavior of glass-forming ability and mechanical response in a series of equiatomic binary to denary metallic glasses. Materialia 2020, 9, 100505 10.1016/j.mtla.2019.100505. [DOI] [Google Scholar]
- Georgarakis K.; Louzguine-Luzgin D. V.; Antonowicz J.; Vaughan G.; Yavari A. R.; Egami T.; Inoue A. Variations in atomic structural features of a supercooled Pd–Ni–Cu–P glass forming liquid during in situ vitrification. Acta Mater. 2011, 59, 708–716. 10.1016/j.actamat.2010.10.009. [DOI] [Google Scholar]
- Derjaguin B. V.; Muller V. M.; Toporov Y. P. Effect of contact deformations on the adhesion of particles. J. Colloid Interface Sci. 1975, 53, 314–326. 10.1016/0021-9797(75)90018-1. [DOI] [Google Scholar]
- Cost J. R.; Janowski K. R.; Rossi R. C. Elastic properties of isotropic graphite. Philos. Mag. A 1968, 17, 851–854. 10.1080/14786436808223035. [DOI] [Google Scholar]
- Jakes J. E. Improved methods for nanoindentation Berkovich probe calibrations using fused silica. J. Mater. Sci. 2018, 53, 4814–4827. 10.1007/s10853-017-1922-8. [DOI] [Google Scholar]
- Kim J. H.; Kang S.; Park J.-W.; Park E.-D.; Jun Y.-K.; Han J. Y.; Jung J. H.; Kim N.; Lee G.-H. Tailored Hydrogen-Free Carbon Films by Tuning the sp2/sp3 Configuration. ACS Appl. Electron. Mater. 2021, 3, 1771–1779. 10.1021/acsaelm.1c00046. [DOI] [Google Scholar]
- Kim J. H.; Hyun C.; Kim H.; Dash J. K.; Ihm K.; Lee G.-H. Thickness-insensitive properties of α-MoO3 nanosheets by weak interlayer coupling. Nano Lett. 2019, 19, 8868–8876. 10.1021/acs.nanolett.9b03701. [DOI] [PubMed] [Google Scholar]
- Zhang G.; Moenig R.; Park Y.; Volkert C.. Thermal fatigue failure analysis of copper interconnects under alternating currents. In 2005 6th International Conference on Electronic Packaging Technology; IEEE: 2005; pp 1–4. [Google Scholar]
- Brighenti R.; Carpinteri A. Surface cracks in fatigued structural components: a review. Fatigue Fract. Eng. Mater. Struct. 2013, 36, 1209–1222. 10.1111/ffe.12100. [DOI] [Google Scholar]
- Wang C.-C.; Mao Y.-W.; Shan Z.-W.; Dao M.; Li J.; Sun J.; Ma E.; Suresh S. Real-time, high-resolution study of nanocrystallization and fatigue cracking in a cyclically strained metallic glass. Proc. Natl. Acad. Sci. U. S. A. 2013, 110, 19725–19730. 10.1073/pnas.1320235110. [DOI] [PMC free article] [PubMed] [Google Scholar]
- Wang G.; Liaw P. K.; Jin X.; Yokoyama Y.; Huang E.-W.; Jiang F.; Keer L. M.; Inoue A. Fatigue initiation and propagation behavior in bulk-metallic glasses under a bending load. J. Appl. Phys. 2010, 108, 113512 10.1063/1.3501102. [DOI] [Google Scholar]
- Wang G.; Liaw P.; Yokoyama Y.; Inoue A.; Liu C. Fatigue behavior of Zr-based bulk-metallic glasses. Mater. Sci. Eng., A 2008, 494, 314–323. 10.1016/j.msea.2008.04.034. [DOI] [Google Scholar]
- Yokoyama Y.; Liaw P. K.; Nishijima M.; Hiraga K.; Buchanan R. A.; Inoue A. Fatigue-strength enhancement of cast Zr50Cu40Al10 glassy alloys. Mater. Trans. 2006, 47, 1286–1293. 10.2320/matertrans.47.1286. [DOI] [Google Scholar]
- Wang G.; Liaw P.; Peter W.; Yang B.; Yokoyama Y.; Benson M.; Green B.; Kirkham M.; White S.; Saleh T.; McDaniels R. L.; Steward R. V.; Buchanan R. A.; Liu C. T.; Brooks C. R. Fatigue behavior of bulk-metallic glasses. Intermetallics 2004, 12, 885–892. 10.1016/j.intermet.2004.02.043. [DOI] [Google Scholar]
- Weibull W. A statistical distribution function of wide applicability. J. Appl. Mech. 1951, 18, 290–293. 10.1115/1.4010337. [DOI] [Google Scholar]
- Chuang C.-P.; Yuan T.; Dmowski W.; Wang G.-Y.; Freels M.; Liaw P. K.; Li R.; Zhang T. Fatigue-induced damage in zr-based bulk metallic glasses. Sci. Rep. 2013, 3, 2578. 10.1038/srep02578. [DOI] [PMC free article] [PubMed] [Google Scholar]
- Quinn J. B.; Quinn G. D. A practical and systematic review of Weibull statistics for reporting strengths of dental materials. Dent. Mater. 2010, 26, 135–147. 10.1016/j.dental.2009.09.006. [DOI] [PMC free article] [PubMed] [Google Scholar]
- Rinaldi A. Effects of dislocation density and sample-size on plastic yielding at the nanoscale: a Weibull-like framework. Nanoscale 2011, 3, 4817–4823. 10.1039/c1nr11023c. [DOI] [PubMed] [Google Scholar]
- Pugno N.; Ruoff R. Nanoscale weibull statistics. J. Appl. Phys. 2006, 99, 024301 10.1063/1.2158491. [DOI] [Google Scholar]
- Berger M.-H.; Jeulin D. Statistical analysis of the failure stresses of ceramic fibres: Dependence of the weibull parameters on the gauge length, diameter variation and fluctuation of defect density. J. Mater. Sci. 2003, 38, 2913–2923. 10.1023/A:1024405123420. [DOI] [Google Scholar]
- Gao H.-L.; Shen Y.; Xu J. Weibull analysis of fracture strength for Zr55Ti2Co28Al15 bulk metallic glass: Tension–compression asymmetry and porosity effect. J. Mater. Res. 2011, 26, 2087–2097. 10.1557/jmr.2011.210. [DOI] [Google Scholar]
- Rinaldi A.; Peralta P.; Sieradzki K.; Traversa E.; Licoccia S. Role of dislocation density on the sample-size effect in nanoscale plastic yielding. J. Nanomech. Micromech. 2012, 2, 42–48. 10.1061/(ASCE)NM.2153-5477.0000047. [DOI] [Google Scholar]
- Zharin A. L.; Rigney D. A. Application of the contact potential difference technique for on-line rubbing surface monitoring. Tribol. Lett. 1998, 4, 205–213. 10.1023/A:1019171625552. [DOI] [Google Scholar]
- Levitin V.; Garin O.; Yatsenko V.; Loskutov S. On structural sensibility of work function. Vacuum 2001, 63, 367–370. 10.1016/S0042-207X(01)00215-9. [DOI] [Google Scholar]
- Zharin A.; Fishbejn E.; Shipitsa N. Effect of contact deformation upon surface electron work function. J. Frict. Wear 1995, 16, 66–78. [Google Scholar]
- Kimura H.; Asami K.; Inoue A.; Masumoto T. The oxidation of amorphous Zr-base binary alloys in air. Corros. Sci. 1993, 35, 909–915. 10.1016/0010-938X(93)90308-4. [DOI] [Google Scholar]
- Tam C. Y.; Shek C. H.; Wang W. Oxidation behaviour of a Cu-Zr-Al bulk metallic glass. Rev. Adv. Mater. Sci 2008, 18, 107–111. [Google Scholar]
- Lide D. R.CRC handbook of chemistry and physics; CRC press: 2004; Vol. 85. [Google Scholar]
- Morant C.; Sanz J.; Galan L.; Soriano L.; Rueda F. An XPS study of the interaction of oxygen with zirconium. Surf. Sci. 1989, 218, 331–345. 10.1016/0039-6028(89)90156-8. [DOI] [Google Scholar]
- Liu J.; Li J.; Wu J.; Sun J. Structure and dielectric property of high-k ZrO2 films grown by atomic layer deposition using tetrakis (dimethylamido) zirconium and ozone. Nanoscale Res. Lett. 2019, 14, 154. 10.1186/s11671-019-2989-8. [DOI] [PMC free article] [PubMed] [Google Scholar]
- Chastain J.; King R. C. Jr.. Handbook of X-ray photoelectron spectroscopy; Perkin-Elmer Corporation: 1992; Vol. 40, p 221. [Google Scholar]
- Oluwabi A. T.; Gaspar D.; Katerski A.; Mere A.; Krunks M.; Pereira L.; Oja Acik I. Influence of post-UV/Ozone treatment of ultrasonic-sprayed zirconium oxide dielectric films for a Low-temperature oxide thin film transistor. Materials 2020, 13, 6. 10.3390/ma13010006. [DOI] [PMC free article] [PubMed] [Google Scholar]
- Mondal K.; Chatterjee U.; Murty B. Oxidation behavior of multicomponent Zr-based amorphous alloys. J. Alloys Compd. 2007, 433, 162–170. 10.1016/j.jallcom.2006.06.061. [DOI] [Google Scholar]
- Tam C.; Shek C. Effects of alloying on oxidation of Cu-based bulk metallic glasses. J. Mater. Res. 2005, 20, 2647–2653. 10.1557/JMR.2005.0336. [DOI] [Google Scholar]
- Jastrow L.; Köster U.; Meuris M. Catastrophic oxidation of Zr-TM (noble metals) glasses. Mater. Sci. Eng., A 2004, 375–377, 440–443. 10.1016/j.msea.2003.10.071. [DOI] [Google Scholar]
- Brossmann U.; Würschum R.; Södervall U.; Schaefer H.-E. Oxygen diffusion in ultrafine grained monoclinic ZrO2. J. Appl. Phys. 1999, 85, 7646–7654. 10.1063/1.370567. [DOI] [Google Scholar]
Associated Data
This section collects any data citations, data availability statements, or supplementary materials included in this article.