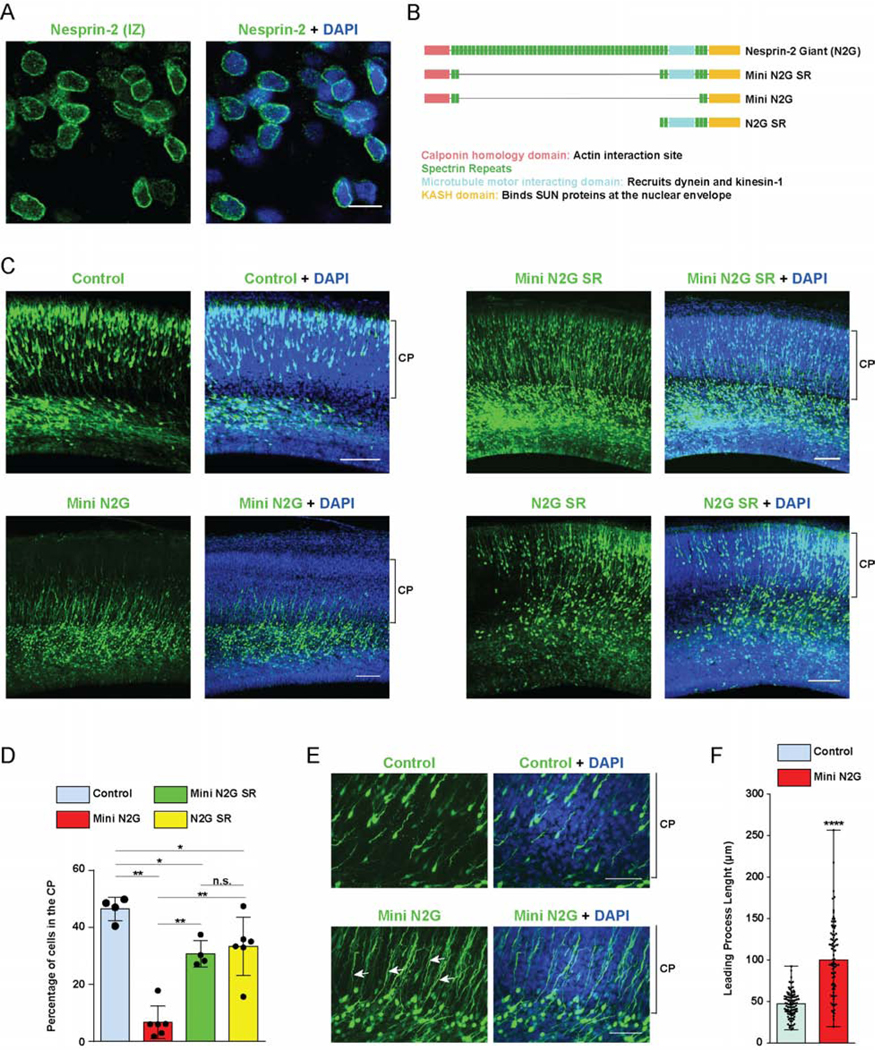
Figure 1. Roles of Nesprin-2 functional domains in neuronal migration.

(A) E20 rat brain slices were immunostained for endogenous Nesprin-2 and with DAPI (blue). A representative image from the Intermediate Zone (IZ) where post-mitotic neurons start to migrate is shown. Clear Nesprin-2 decoration of the nuclear envelope (NE) is observed. (B) Diagrammatic representation of the Nesprin-2 Giant (N2G) isoform, and the engineered fragments designed for actin- (Mini N2G) or, microtubule motor- (N2G SR)-binding, or both (Mini N2G SR) [22]. (C-F) E16 rat brain was electroporated with IRES vectors expressing GFP alone or with the Mini N2G SR, Mini N2G or N2G SR constructs. Slices from fixed brains were imaged 4 days following electroporation at E20. (C) Representative images of the neocortex with electroporated cells in green. Brackets show Cortical Plate (CP) margins. (D) Proportion of cells reaching the CP. The Mini N2G expression substantially impaired neuronal migration, whereas Mini N2G SR and N2G SR caused only moderate inhibition. (E) Magnified images of the upper IZ and lower CP of control- and Mini N2G-electroporated brains. Mini N2G-expressing cells have markedly elongated leading processes (arrows). (F) Quantification of leading process length in electroporated neurons. Data presented as scatter dot plot with bar representing mean±s.d in D, and with bar representing median with range in F. Mann Whitney test for non-parametric distributions was used in D and unpaired T-Test with Welch’s correction in F (*P<0.05; **P<0.01; ****P<0.0001; n.s. non-significant). Data in D include at least of 967 electroporated cells from at least 4 embryos per condition. Data in F include at least 83 neurons from at least 3 embryos, per condition. A scale bar, 10μm. C scale bar, 100μm. E scale bar, 50μm. Related to Figure S1.
