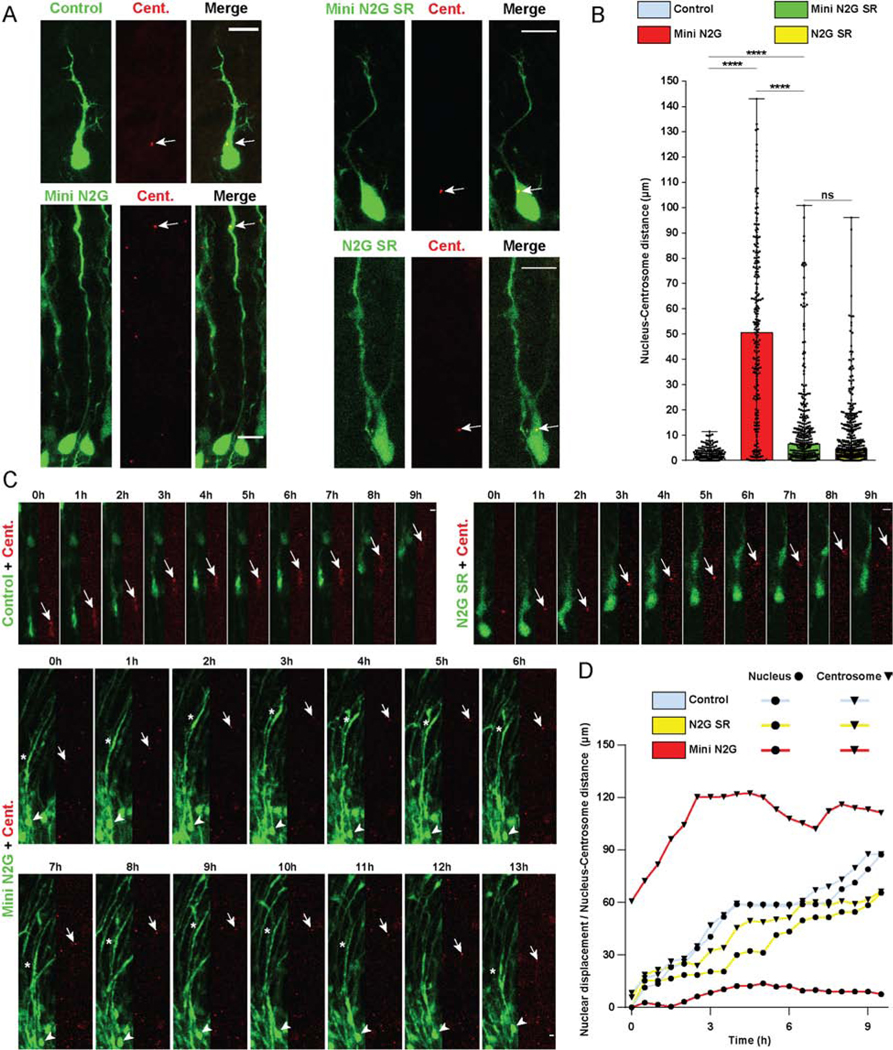
Figure 2. Roles of Nesprin-2 functional domains in Nucleus-Centrosome coupling.

(A-D) E16 rat brain was electroporated with control vector or Nesprin-2 functional domains, in each case co-expressing soluble GPF to indicate position of soma, together with PACT-DsRed construct to mark centrosomes. Brain slices were imaged fixed or live at E20. (A) Representative images of electroporated neurons in the CP showing centrosome (Cent.) (arrow) and soma position within the migrating neuron. (B) Quantification of Nucleus-Centrosome (N-C) distance for each condition. Expression of the Mini N2G construct, lacking the microtubule motor-binding domain, increased N-C distance by more than 50-fold compared to empty vector, and more than 7-fold compared to the Mini N2G SR. (C) Time-lapse with dual-channel images for the soma and centrosome (red) are shown at 1h intervals (Videos S1–3). Arrows, arrowheads, and asterisks indicate, respectively, centrosomes, cell bodies, and leading process dilations. (D) Graphical representation of relative position of the nucleus and centrosome over time. For each condition, nuclear displacement (●) was measured over time, relative to the original position (t=0). For each time point, N-C distance was quantified and summed to the nuclear position (▼). Data presented as scatter dot plot with bar representing median with range in B. Mann Whitney test for non-parametric distributions was used in B (****P<0.0001; n.s. non-significant). Data in B include at least 217 electroporated neurons from at least 3 embryos, per condition. A scale bar, 10μm. C scale bar, 5μm. Related to Videos S1–3.
