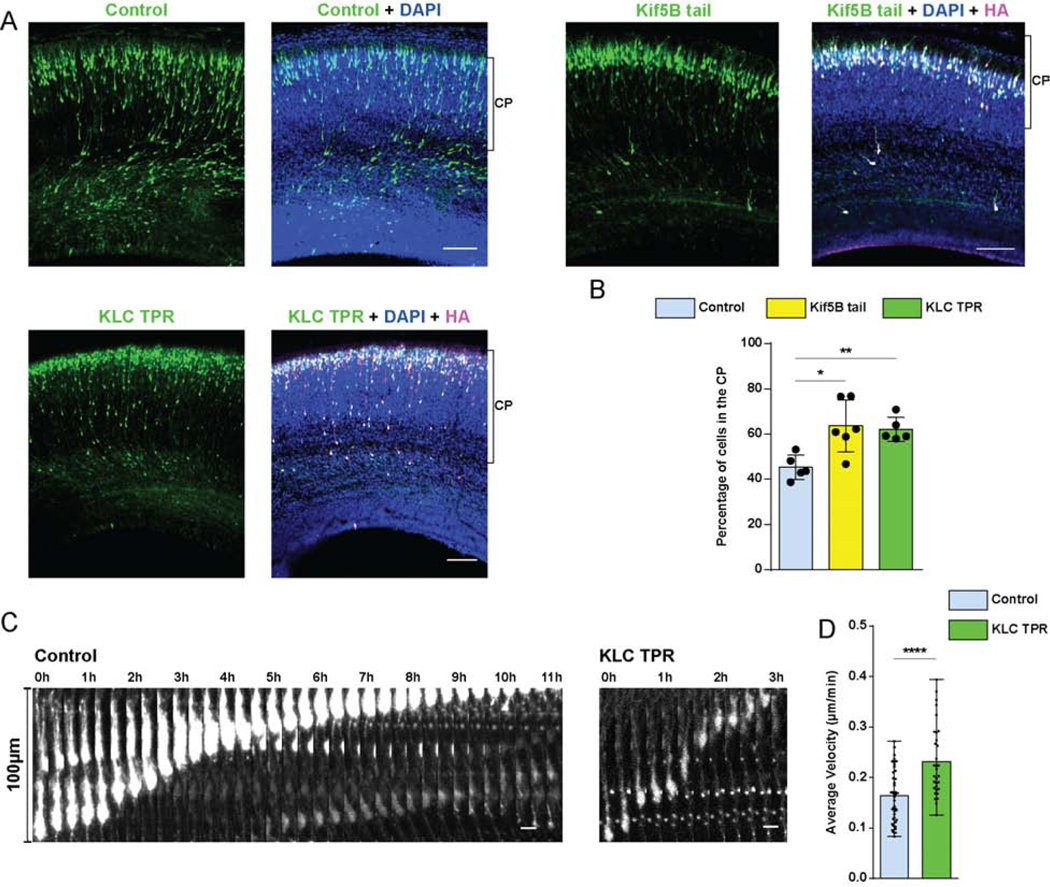
Figure 5. Role of Kinesin-1 in neuronal migration.

(A, B) E16 rat brain was electroporated with IRES vectors encoding GFP and HA-tagged Kif5B tail or HA-tagged KLC TPR cDNA constructs and empty vector control. Fixed images of brain slices were imaged at E20. (A) Representative images of the neocortex with electroporated cells in green, stained with DAPI (blue) and immunostained for HA, in magenta. Brackets show boundaries of CP. (B) Quantification of cells reaching CP. Expression of the Kif5B tail or KLC TPR domains caused a considerable increase of neurons within the CP. (C, D) E16 rat brain was electroporated with the KLC TPR construct and empty vector, and brain slices imaged live at E20. (C) Time-lapse images for control and KLC TPR-expressing neurons (Videos S5-6) over a time period sufficient in each case to complete 100μm of nuclear displacement. Images are shown at 20 min intervals. (D) Quantification of neuronal migration velocity, from initiation of nuclear migration in each cell until its termination, in control vs. KLC TPR expressing neurons. Expression of KLC-TPR resulted in significantly higher migration velocity vs that for the control. Data presented as scatter dot plot with bar representing mean±s.d. in B, and as scatter dot plot with bar representing mean with range in D. Mann Whitney test for non-parametric distributions was used in B (*P<0.05; **P<0.01). Unpaired T-Test with Welch’s correction was used in D (****P<0.0001). Data in B include at least 967 electroporated cells from at least 4 embryos, per condition. Data in D include 42 and 32 migrating neurons for control and KLC TPR, respectively. A scale bar, 100μm. C scale bar, 10μm. Related to Figure S4 and Videos S5-6.
