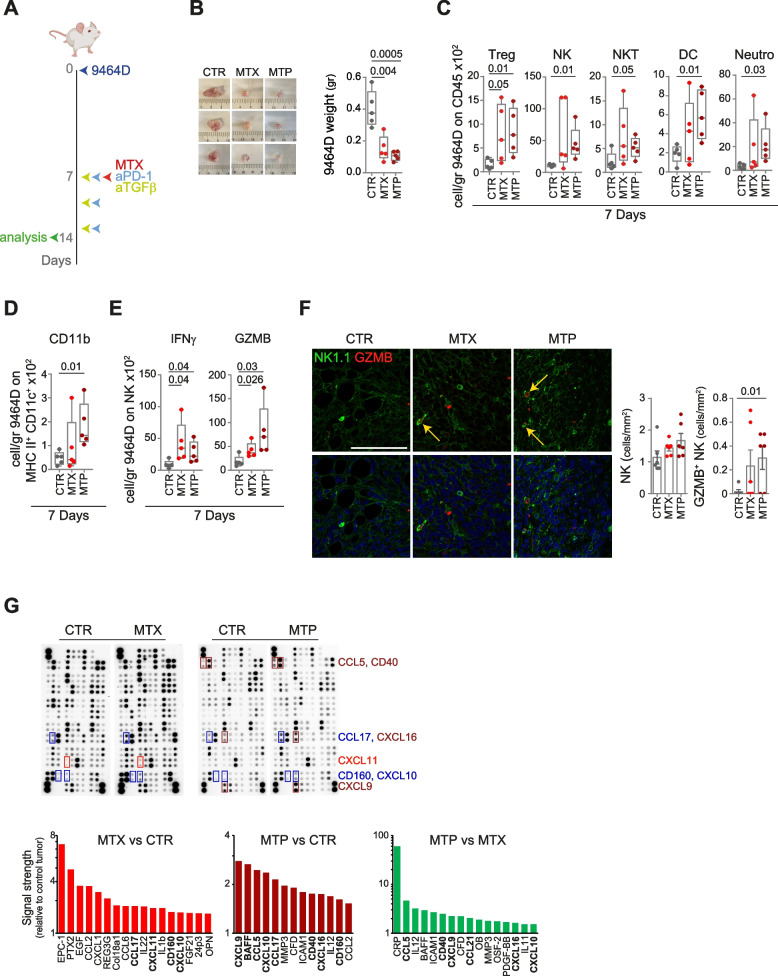
Fig. 6.
Treatment with low-dose mitoxantrone in combination with TGFβ and PD-1 blockade delays the growth of orthotopically transplanted tumors and reshapes the intratumoral infiltrate. A Schematic representation of the drug treatment and timing of tumor immune infiltrate analysis. B Representative images and weight of explanted tumors at day 7 after the start of treatment. C-E Flow-cytometry analysis of the immune content (C, D) and activation status of tumor-infiltrating NK cells (E) in 7 day-treated 9464D tumors. F Multiple immunofluorescence staining of drug-treated 9464D tumor specimens for NK1.1 (green) and granzyme B (red) shown at original magnification × 40 (zoom), scale bar 30 μm. Images with nuclei (Hoechst) are shown in the bottom panel. Granzyme B-positive NK cells are indicated by yellow arrows. Quantitative analysis of the indicated immune cells from n = 6 biologically independent 9464D specimens is shown on the right. Levels of significance for comparison between samples in C-F were determined by ANOVA. G Chemokine expression in 7 day-drug-treated 9464D lysates by protein array. Relative chemokine expression based on densitometric analysis is shown on the right. CTR, vehicle control; MTX, mitoxantrone; MTP, mitoxantrone, anti-TGFβ and anti-PD-1; GZMB, granzyme B. Statistically significant P values are shown

