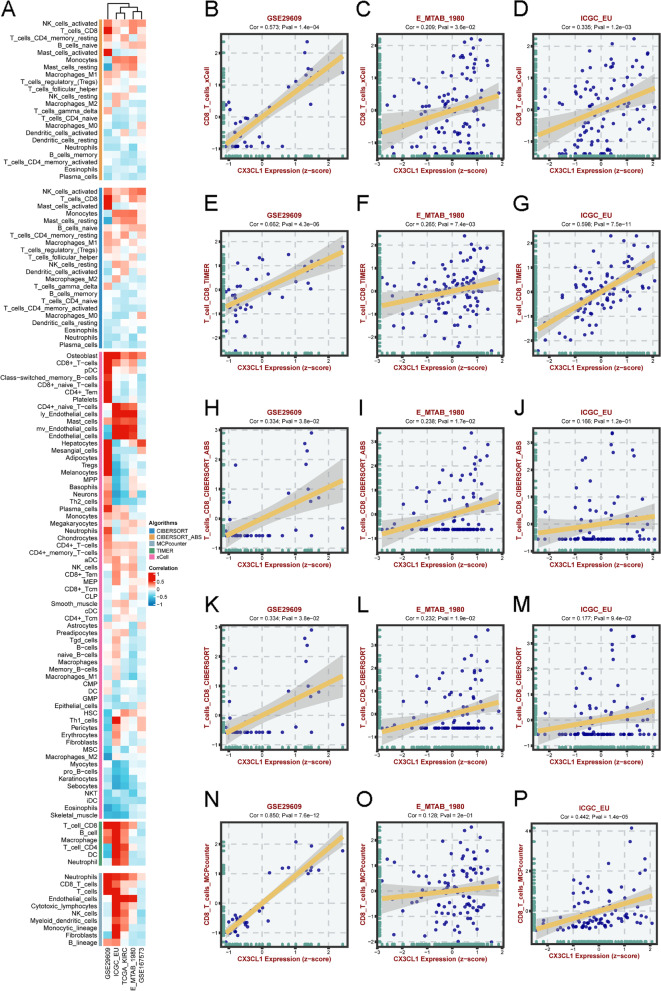
Fig. 4.
Correlation analysis of CX3CL1 expression and immune cell infiltration levels in different databases. A Correlation analysis between CX3CL1 expression and infiltration levels of different immune cells in GSE29609, ICGC_EU, TCGA-KIRC, E_MTAB_1980, and GSE167573 cohorts by different algorithms, including CIBERSORT, CIBERSORT_ABS, MCPcounter, TIMER, and xCell. B-D The association between CX3CL1 expression and CD8+ T cells in GSE29609, E_MTAB_1980, and ICGC_EU, was analyzed by xCell. E-G The association between CX3CL1 expression and CD8+ T cells in GSE29609, E_MTAB_1980, and ICGC_EU, was analyzed by TIMER. H-J The association between CX3CL1 expression and CD8+ T cells in GSE29609, E_MTAB_1980, and ICGC_EU was analyzed by CIBERSORT_ABS. K-M The association between CX3CL1 expression and CD8+ T cells in GSE29609, E_MTAB_1980, and ICGC_EU, was analyzed by CIBERSORT. N-P The association between CX3CL1 expression and CD8+ T cells in GSE29609, E_MTAB_1980, and ICGC_EU, was analyzed by MCPcounter

