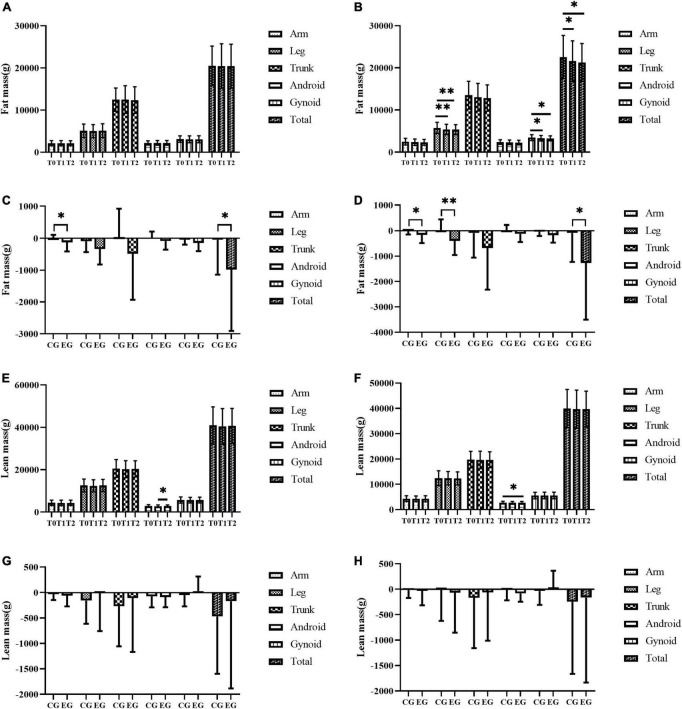
FIGURE 2.
The effect of exercise on fat content and lean mass in all parts of the body. (A–H) The fat mass of all parts of the body in the control group (A), the fat mass of all parts of the body in the exercise group (B), comparison of difference values between three months and baseline in different groups on fat mass in all parts of the body (C), comparison of difference values between 6 months and baseline in different groups on fat mass in all parts of the body (D), the lean mass of all parts of the body in the control group (E), the lean mass of all parts of the body in the exercise group (F), comparison of difference values between three months and baseline in different groups on lean mass in all parts of the body (G), comparison of difference values between six months and baseline in different groups on lean mass in all parts of the body (H). T0, T1, and T2 represent baseline, 3 months, and 6 months respectively. CG and EG represent control group and exercise group respectively. * represents p < 0.05 and ** represents p < 0.01.

