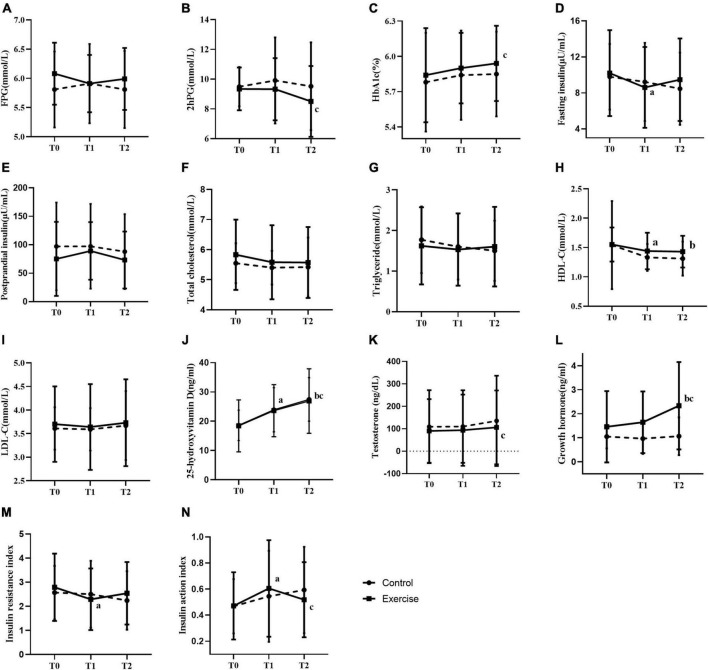
FIGURE 3.
Effect of exercise on glucose and lipid metabolism. (A–N) Fasting blood-glucose (A), 2–hour post-meal blood glucose (B), glycated hemoglobin% (C), fasting insulin (D), postprandial serum insulin (E), total cholesterol (F), triglyceride (G), high density lipoprotein cholesterol (H), low density lipoprotein cholesterol (I), 25–hydroxyvitamin D (J), testosterone (K), growth hormone (L), insulin resistance index (M), insulin action index (N). a: significant difference between baseline and the 3rd month in the same group; b: significant difference between baseline and six months in the same group; c: significant difference between 3 months and 6 months in the same group. T0, T1, and T2 represent baseline, 3 months, and 6 months respectively. * represents p < 0.05 and ** represents p < 0.01.

