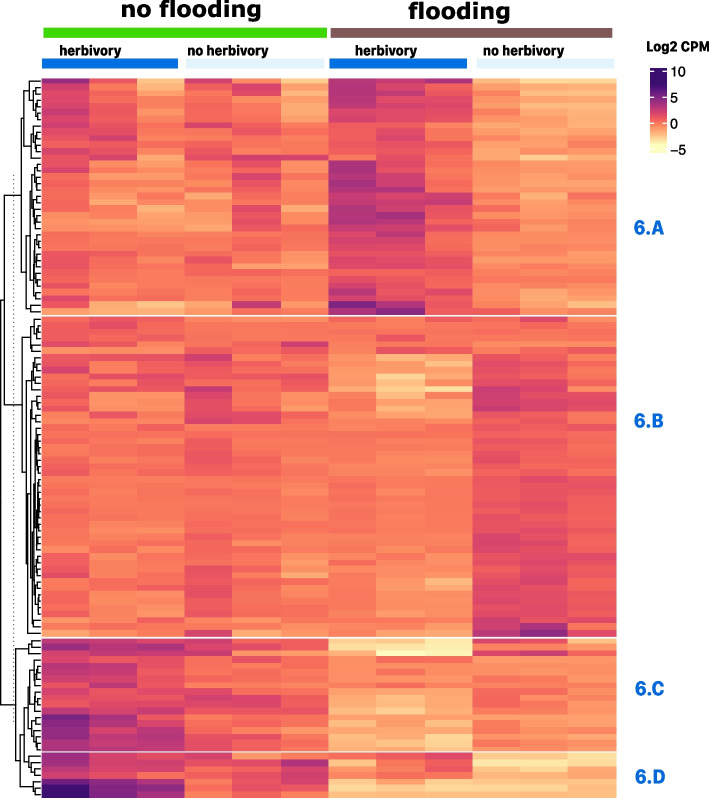
Fig. 6.
K-means clustering analysis of genes differentially expressed in leaf tissue of tomato plants challenged with herbivory and controls in the tomato variety “Cherokee Purple” (fold-change > 4 and; FDR p-value < 0.01). The heatmap has treatments as columns and genes as rows. The top right inset shows the color scale for log2 counts per million (CPM) values with purple tones for up-regulated genes and yellow tones for down-regulated genes. The vertical striped line on dendrogram shows the level at which the tree was cut to separate groups based on k-means. Each separate cluster was named according to figure number followed by and alphabetic character. Each cluster gene content is described in detail in the text

