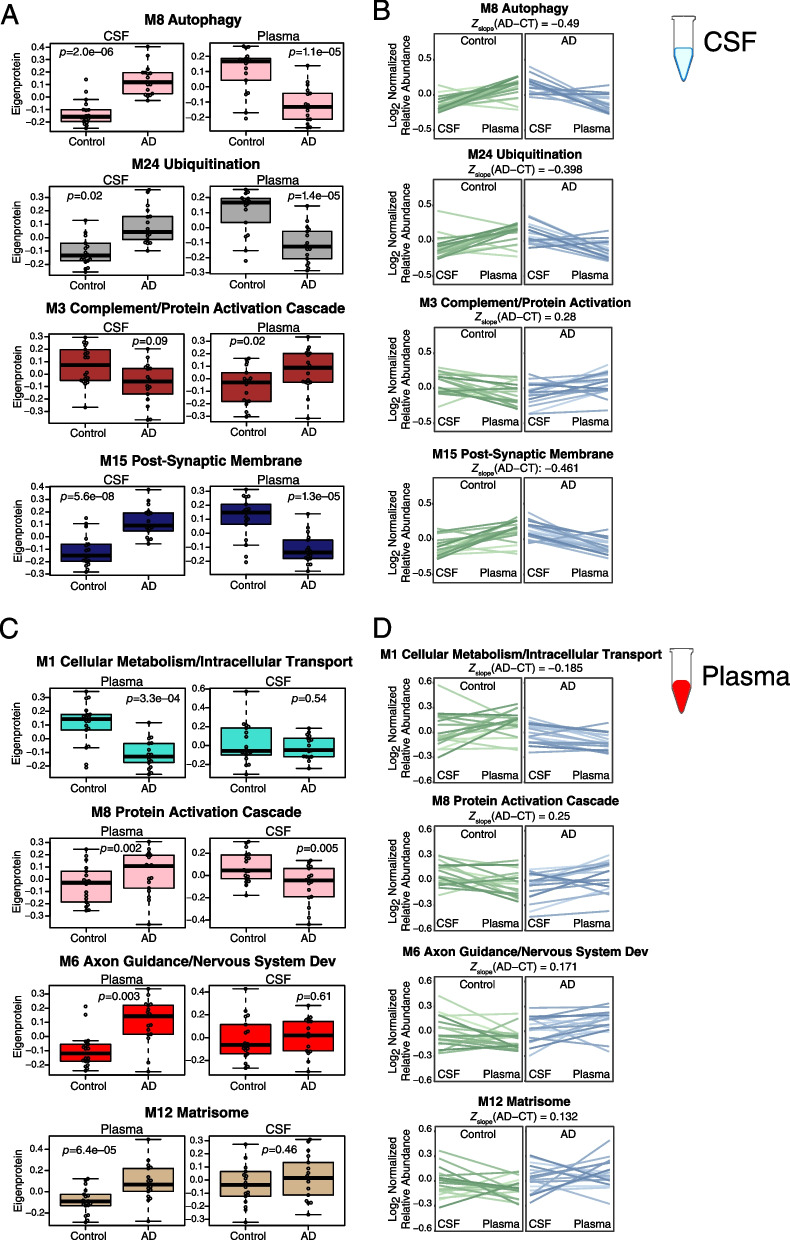
Fig. 10.
Cross-fluid eigenproteins. A–D CSF protein network module eigenproteins and their synthetic eigenproteins in plasma were compared between control and AD groups (A). B Relative eigenprotein levels were compared within subject across fluids in control and AD cases. The difference in average slope (Zslope) between AD and control was calculated for each module. C Plasma protein network module eigenproteins and their synthetic eigenproteins in CSF were compared between control and AD groups. D Relative eigenprotein levels were compared within subject across fluids in control and AD cases. n=18 control, 17 AD for all analyses. Selected modules shown include those that had significant AD trait relationships and were also preserved in CSF by at least one preservation method. Boxplots, within subject cross-fluid eigenproteins, and Zslope calculations for all CSF and plasma modules are provided in Additional file 1: Extended Data. Differences between groups were assessed by t test

