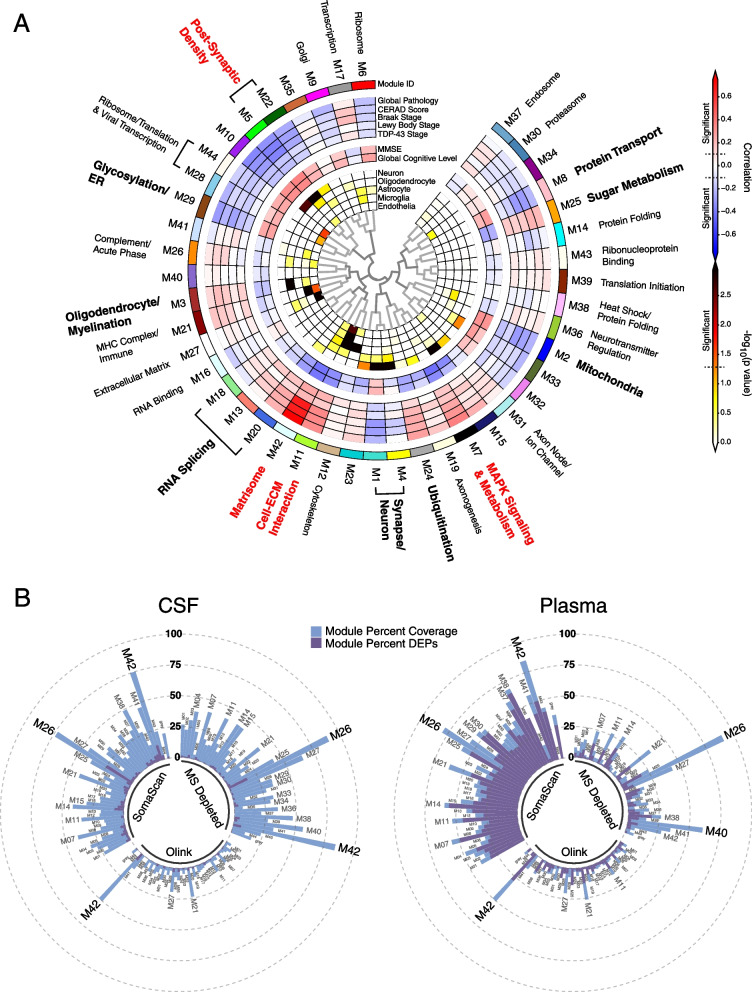
Fig. 5.
Brain protein network module coverage in CSF and plasma by platform. A, B AD brain protein co-expression network constructed from AD, asymptomatic AD, and control brains (total n=488) as described in Johnson et al. [2] A The network was constructed using the weighted co-expression network algorithm (WGCNA) and consisted of 44 protein co-expression modules. Module relatedness is shown in the central dendrogram. The principal biology for each module was defined by gene ontology analysis. Modules that did not have a clear ontology were not assigned an ontology term. As previously described in Johnson et al., brain module eigenproteins were correlated with neuropathological traits in the ROSMAP and Banner cohorts (global pathology, neuritic amyloid plaque burden (CERAD score), tau tangle burden (Braak stage), lewy body burden, and pathological TDP-43 burden); cognitive function (mini-mental state examination (MMSE) score and global cognitive function, higher scores are better); and brain weight and the number of APOE ε4 alleles (0, 1, 2). Red indicates positive correlation, whereas blue indicates negative correlation, with statistical significance threshold at r=0.1 (dotted lines). Twelve of the 44 modules that were most highly correlated to neuropathological and/or cognitive traits are in bold, with the four most strongly trait-related modules highlighted in red. The cell type nature of each module was assessed by module protein overlap with cell type-specific marker lists of neurons, oligodendrocytes, astrocytes, microglia, and endothelia. B Percent module coverage (dashed rings) by each analysis platform in CSF (left) and plasma (right). The percent of module proteins that are measured as differentially expressed proteins (DEPs) by each platform is shown in purple

