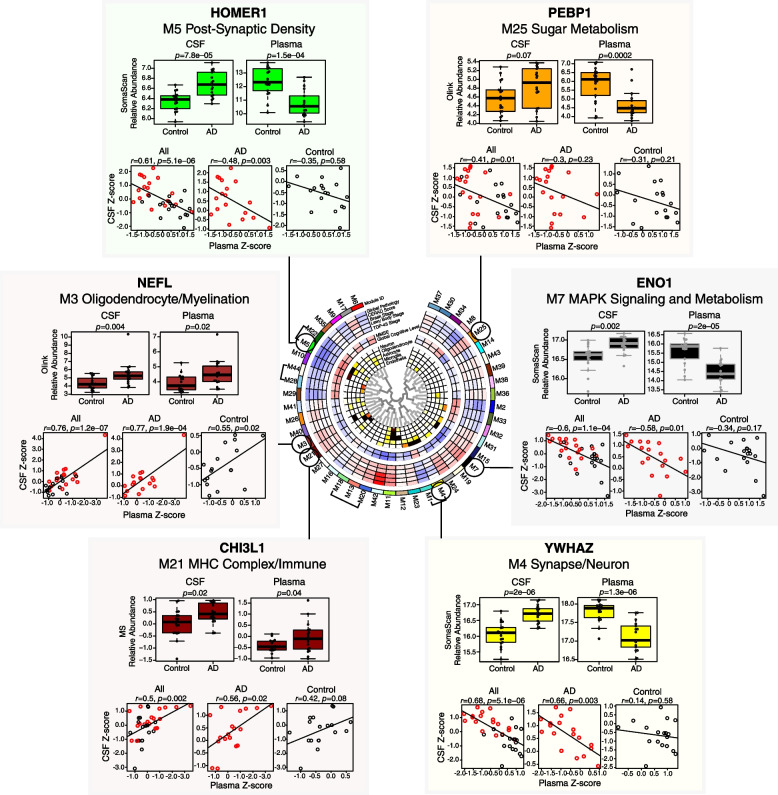
Fig. 7.
AD brain module proteins in CSF and plasma. Proteins that are members of AD brain co-expression modules as described in Johnson et al. [2] and can also be measured in CSF and plasma by one or more proteomic platforms are illustrated for selected disease-related modules. Further details of the brain network are provided in Fig. 5. Relative abundance differences between AD and control in CSF and plasma for each marker were determined by t test, and correlation between relative levels in CSF and plasma within subject was performed by Pearson correlation. CHI3L1, Chitinase-3-like protein 1; ENO1, alpha-enolase; HOMER1, Homer protein homolog 1; NEFL, neurofilament light polypeptide; PEBP1, phosphatidylethanolamine-binding protein 1; YWHAZ, 14-3-3 protein zeta

