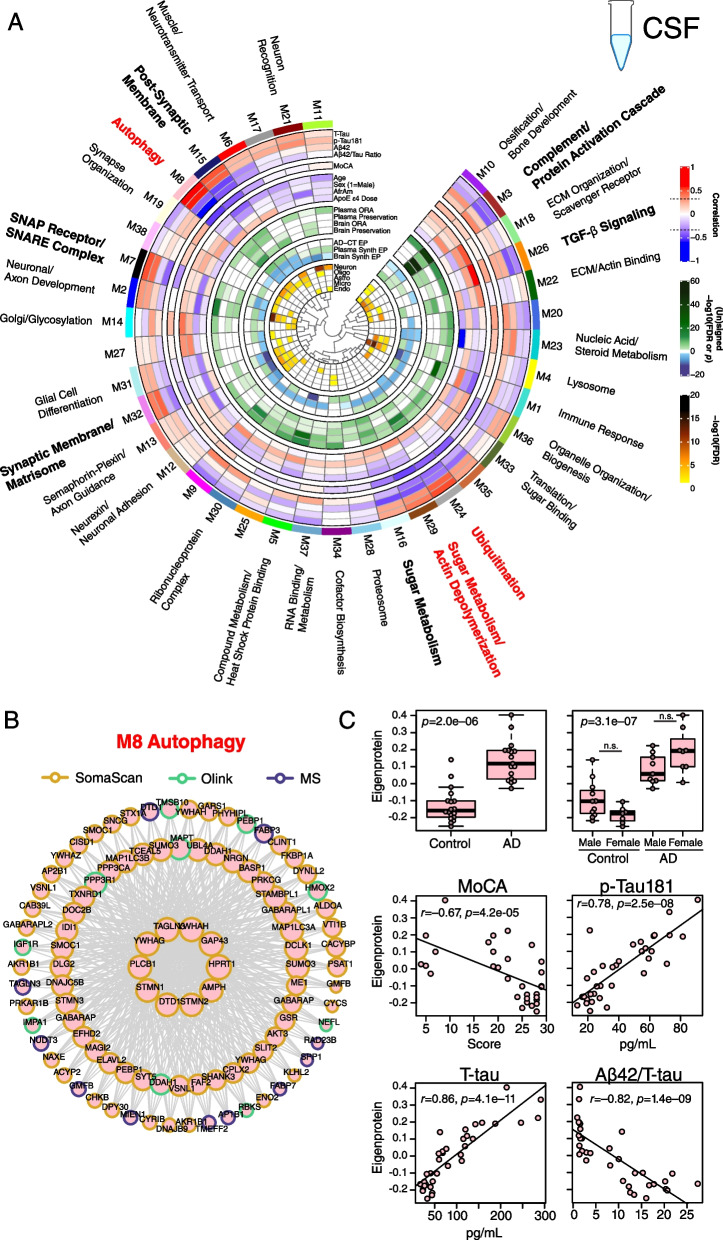
Fig. 8.
AD CSF protein co-expression network. A–C Control (n=18) and AD (n=18) CSF samples were analyzed by TMT-MS, Olink, and Somalogic proteomic platforms, and a protein co-expression network was constructed using the union protein measurements harmonized across all three platforms (n=3594 SomaScan, 902 Olink, and 2662 TMT-MS depleted protein measurements, total n=7158 measurements, n=4154 unique gene symbols). The network consisted of 38 protein co-expression modules. Module relatedness is shown in the central dendrogram. The principal biology for each module was defined by gene ontology analysis. Modules that did not have a clear ontology were not assigned an ontology term. CSF network module eigenproteins were correlated with CSF total tau levels (T-Tau), CSF phospho-tau 181 (p-Tau181) levels, CSF amyloid beta 42 (Aβ42) levels, CSF Aβ42/Tau ratio, Montreal Cognitive Assessment Score (MoCA, higher scores represent better cognitive function), age, sex (1=male, 0=female), African American (AfrAm) status, and the number of apolipoprotein E epsilon 4 alleles (0, 1, 2; ApoE ε4 dose). Red indicates positive correlation, whereas blue indicates negative correlation, with statistical significance threshold at r=0.35 (dotted lines). Nine of the 38 modules that were most highly correlated to CSF pathological or cognitive traits are in bold, with the three most strongly trait-related modules highlighted in red. CSF modules were tested for their presence in the plasma and brain networks by module protein over-representation analysis (ORA) and network preservation (preservation) statistics, as previously described [2]. Only modules that reached statistical significance after FDR correction are colored by degree of significance. ORA p values are for the module with the strongest overlap. In addition to module overlap and preservation analyses, the difference in CSF module eigenprotein between control and AD, or CSF synthetic eigenprotein in plasma and brain between control and AD, was determined. A significantly increased eigenprotein in AD is indicated in green, whereas a significantly decreased eigenprotein is indicated in blue. The cell type nature of each module was assessed by module protein overlap with cell type-specific marker lists of neurons, oligodendrocytes, astrocytes, microglia, and endothelia. B The top 100 proteins by module eigenprotein correlation value (kME) for the M8 Autophagy module (n=156 proteins). Larger nodes represent larger kME values, or module hubs. Module proteins are highlighted according to the proteomic platform in which they were measured. C M8 Autophagy eigenprotein levels between control and AD (top panels), and eigenprotein correlation with MoCA and p-Tau181 (middle panels) and T-tau and Aβ42/T-tau levels (bottom panels). Eigenprotein differences between sexes in control and AD were not significant (p=0.13). Further information on the CSF network is provided in Additional file 2: Supplementary Tables 18 and 19, and Additional file 1: Extended Data. Boxplots represent the median, 25th, and 75th percentiles, and box hinges represent the interquartile range of the two middle quartiles within a group. Datapoints up to 1.5 times the interquartile range from box hinge define the extent of whiskers (error bars). Differences between groups were assessed by t test or one-way ANOVA with Tukey test. Correlations were performed using Pearson correlation. n.s., not significant

