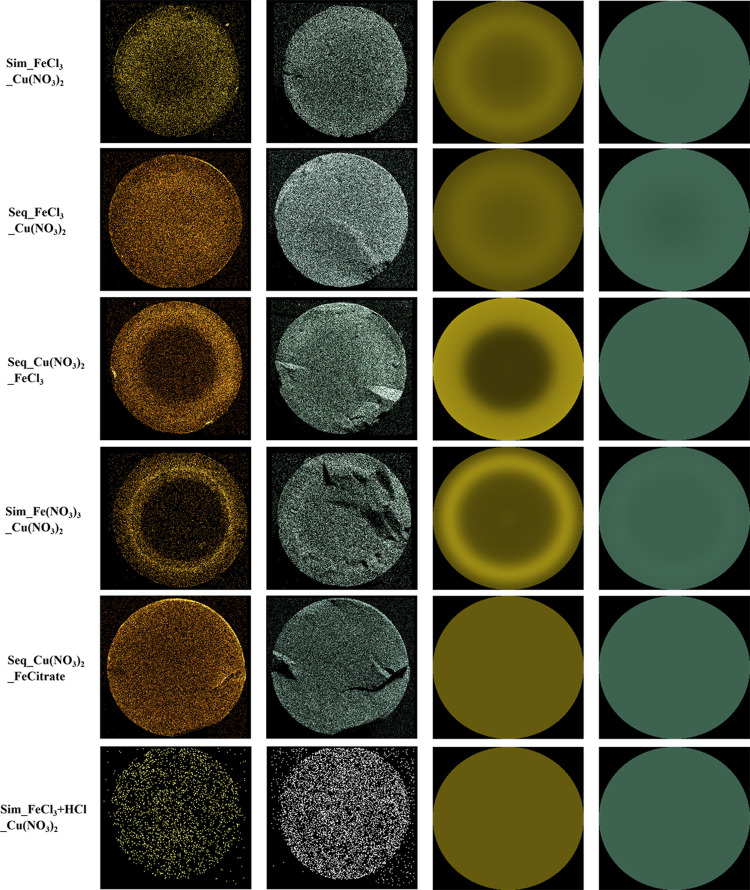
Figure 2.
SEM–EDX mappings of iron and copper throughout the spherical support (left) and the predicted iron and copper distributions according to the simulation (right), for the following selected samples (from top to bottom): samples impregnated with FeCl3 as iron precursor for all three synthesis strategies (simultaneous, iron in the first step and iron in the second step), a sample made with Fe(NO3)3 precursor, a sample made with ferric ammonium citrate, and a sample made with an acidified iron precursor solution. The set of all materials can be found in Figure S6.

