
Figure 8.
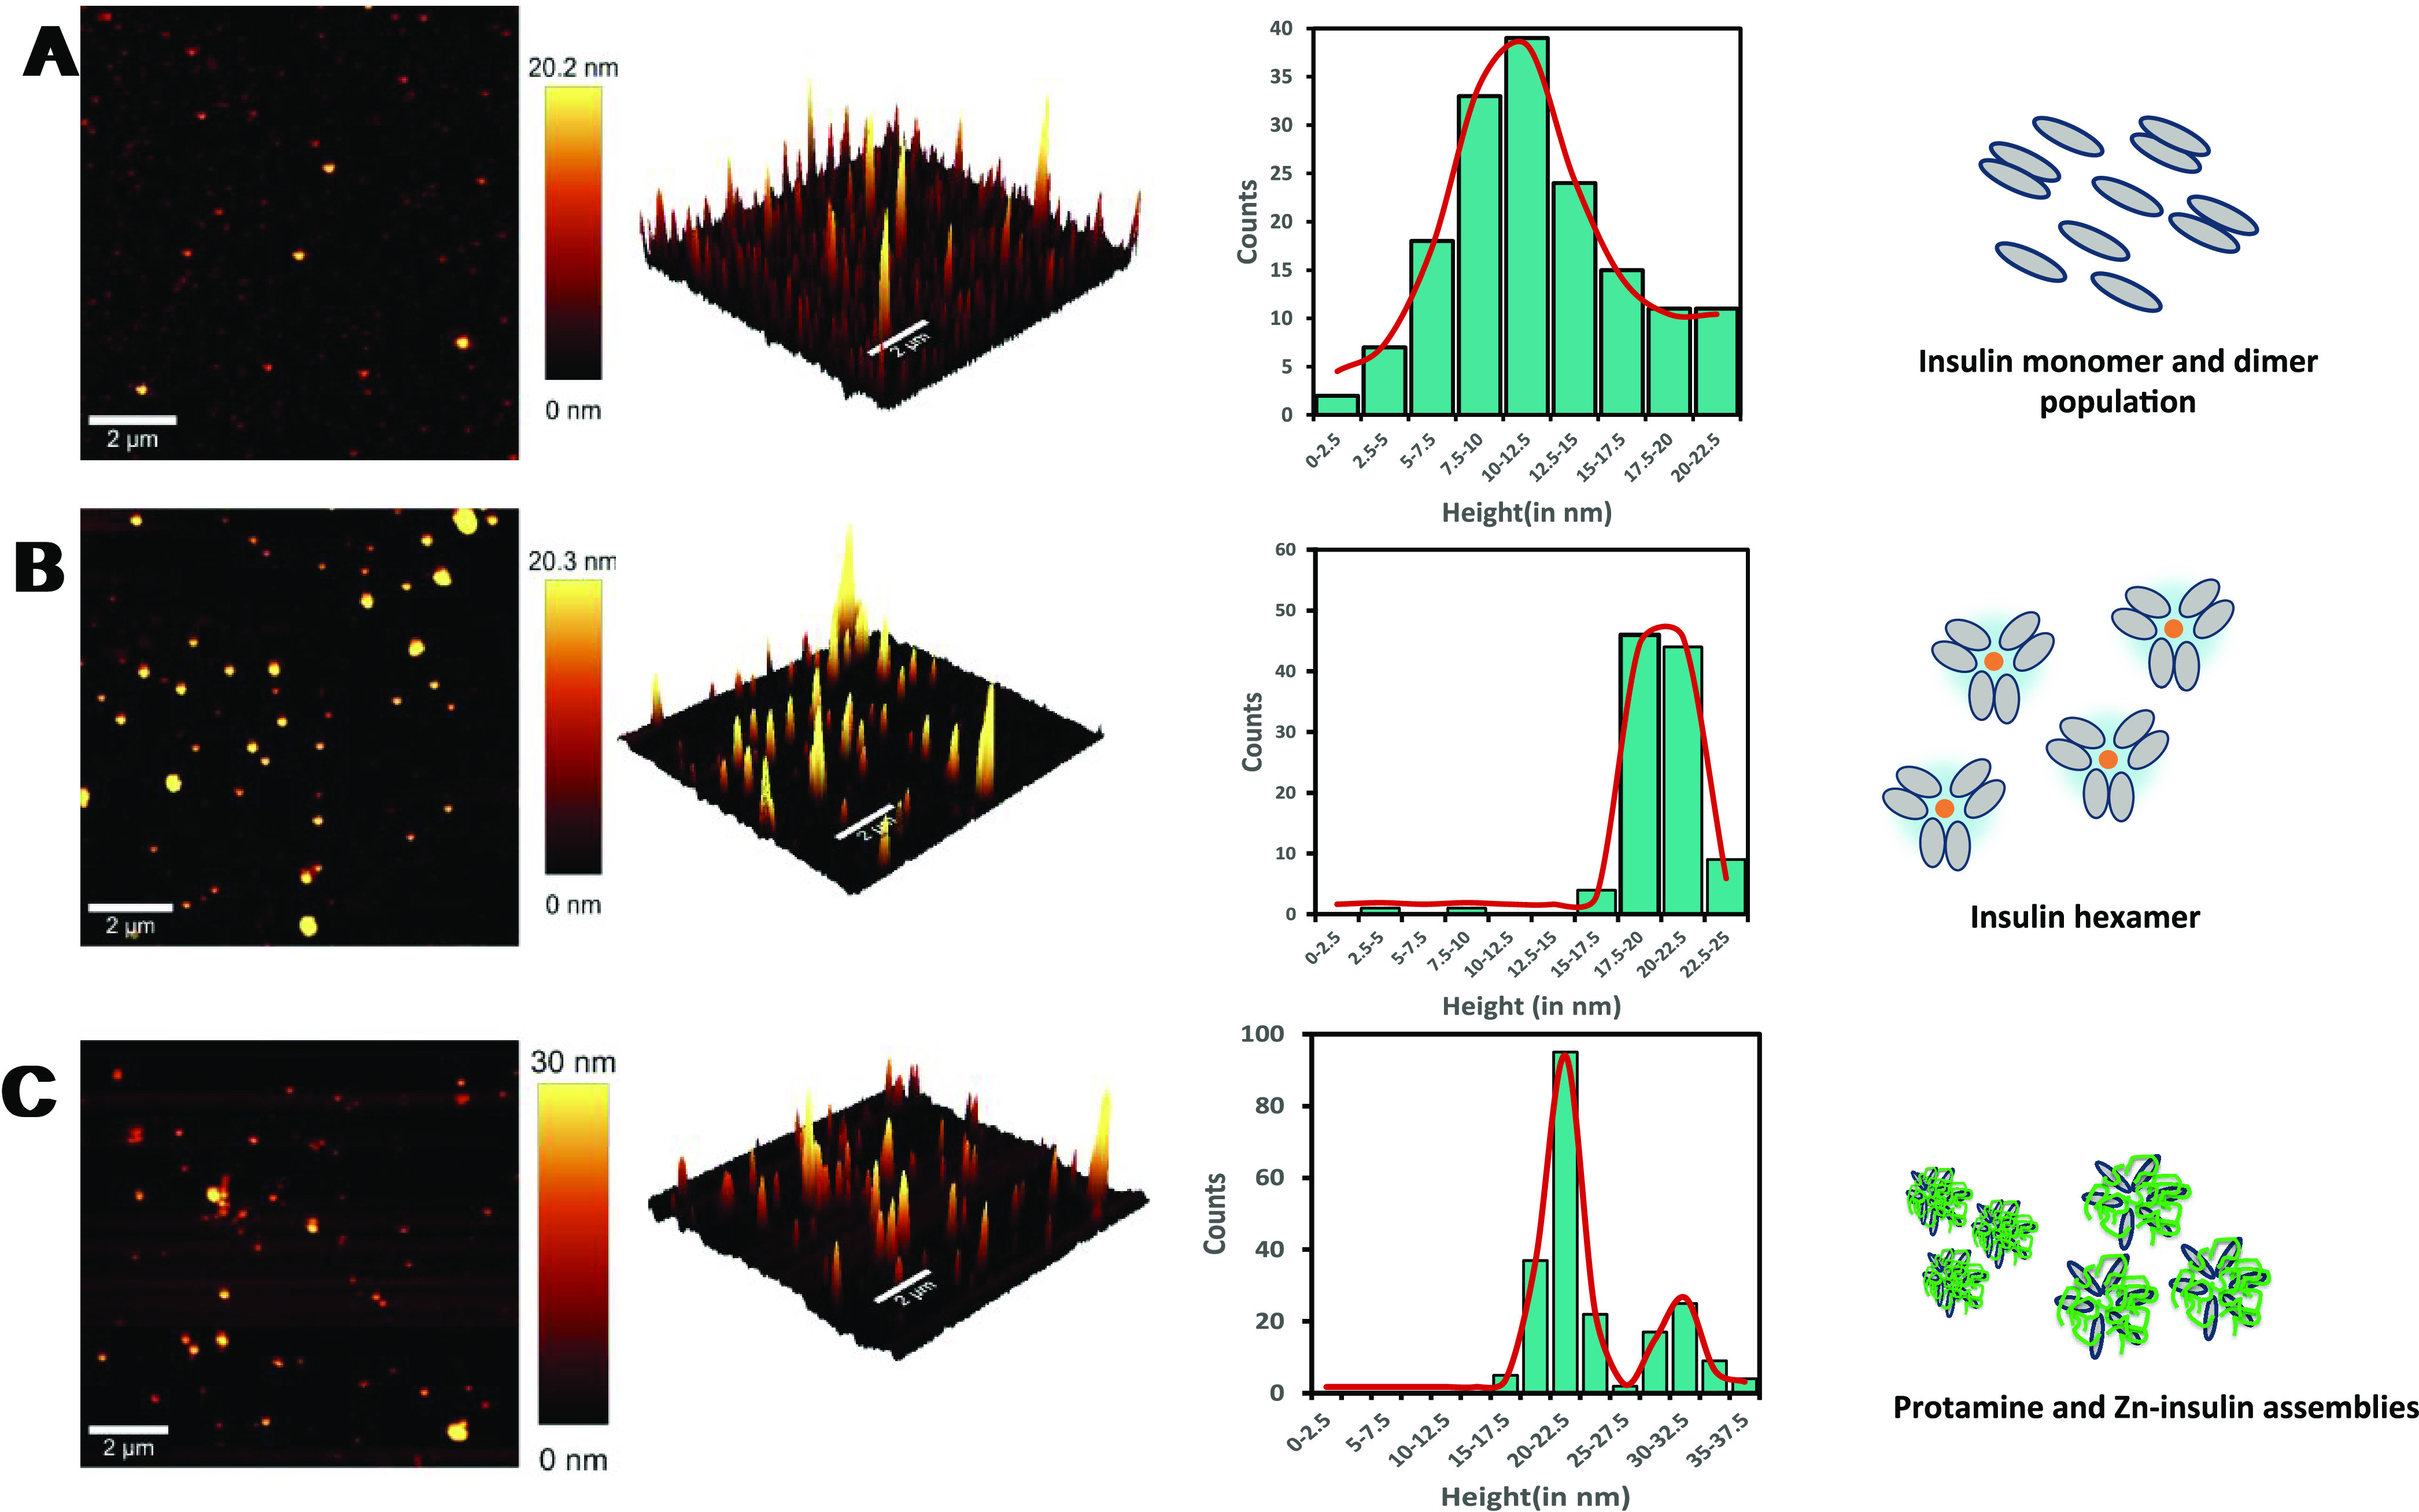
((A–C) From top to bottom) Topography of (A) insulin, (B) Zn–insulin, and (C) protamine–Zn–insulin assembly, followed by (in the respective row) 3D image of the topography, single-molecule statistical analysis with histogram distributions of cross-sectional height of a respective species. In the last column, it is shown how molecules get arranged at different stages in a pictorial form. Insulin units are represented in gray color (monomer, dimer, or hexamer) and protamine in green.