Figure 4.
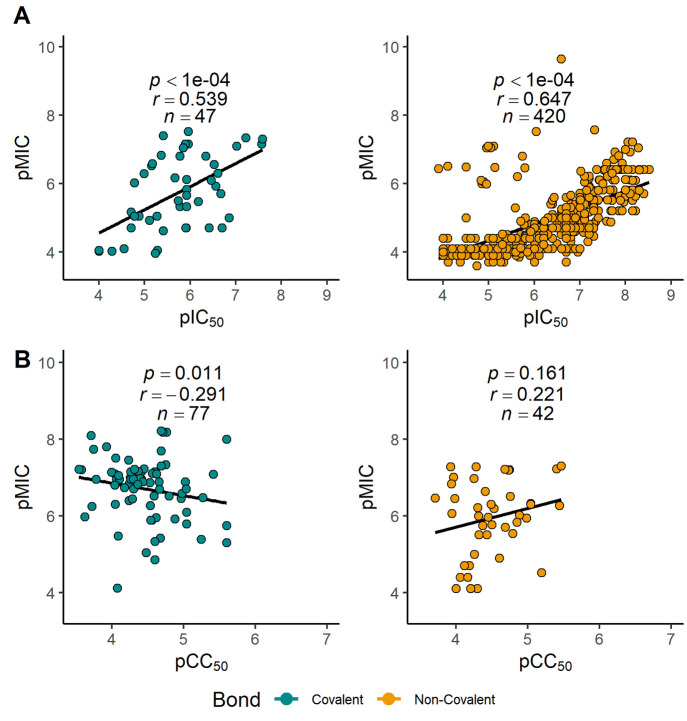
(A) Scatter plot of DprE1 pIC50 (−log10[IC50 (molar)]) versus pMIC (−log10[MIC (molar)]) against Mtb for covalent (left) and noncovalent (right) inhibitors and Pearson correlation coefficient between DprE1 pIC50 and pMIC. (B) Scatter plot of cytotoxicity pCC50 (−log10[CC50 (molar)]) versus pMIC for covalent (left) and noncovalent (right) inhibitors and Pearson correlation coefficient between pCC50 and pMIC.

