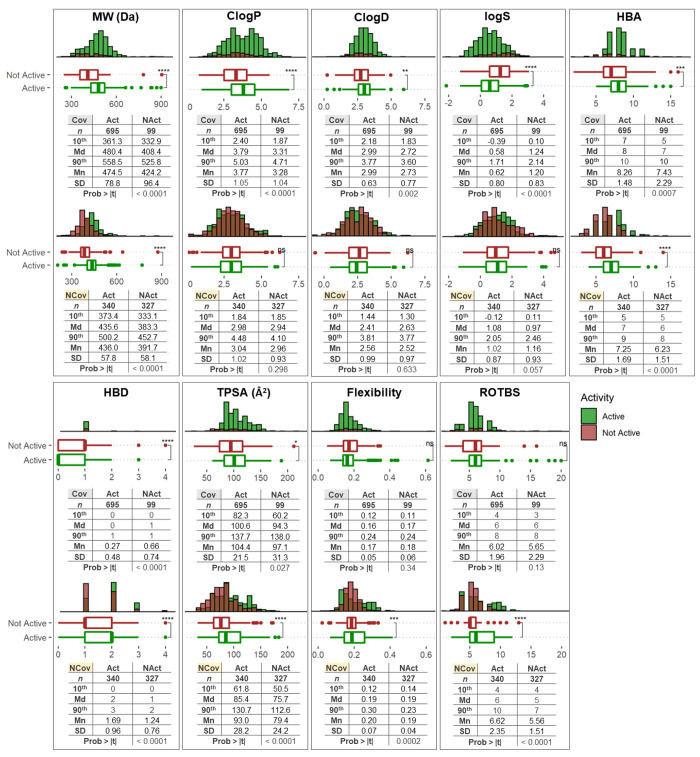
Figure 5.
Physicochemical property distribution and statistics of the inhibitor (Act, in green) and noninhibitor (NAct, in red) classes. Each corresponding binding type (covalent (Cov) upper and noncovalent (NCov) above) is shown for MW, C log P, C log D, log S, HBA, HBD, TPSA, flexibility, and ROTBS. N indicates the total number of compounds considered in each analysis. A two-sided Student’s t-test was used to determine the statistical significance of active and inactive compounds, among those classified as covalent or noncovalent inhibitors, and the p values were evaluated (ns p-value >0.05, *p value <0.05, **p value <0.01, ***p value <0.001, ****p value <0.0001; Md, median; Mn, mean).

