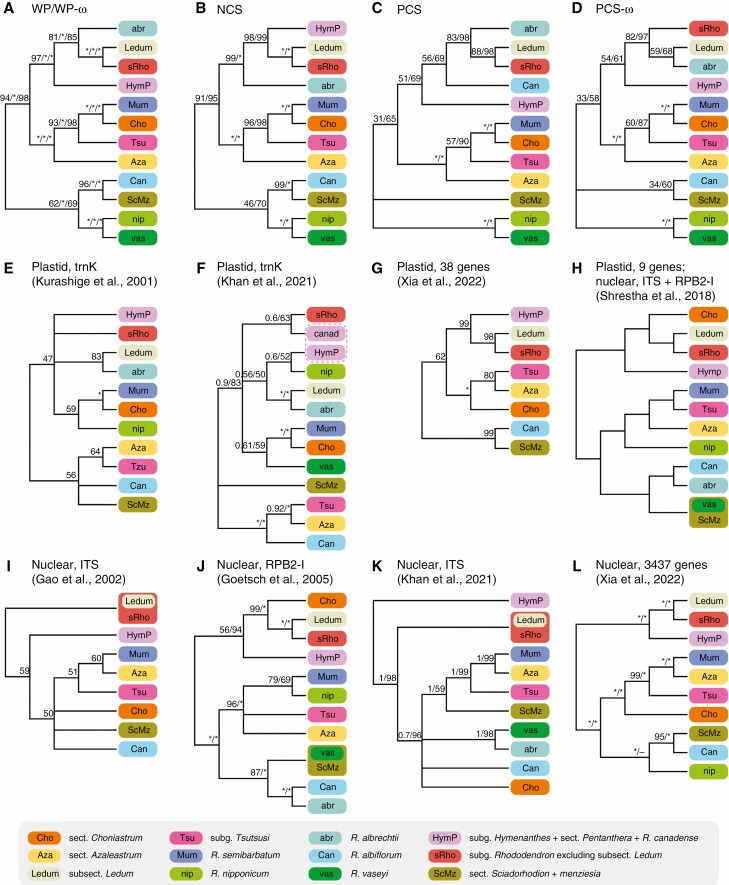
Fig. 4.
Comparisons of phylogenetic relationships of core Rhododendron between our analyses (A–D) and previous studies (E–L). In cases where multiple support values are shown, these are from different analysis methods and stated in the order they are mentioned for each tree, with values of 100 or 1 represented by an asterisk (*). (A) Phylogenetic relationships inferred from dataset WP using RAxML, PhyloBayes and IQ-TREE, which are also recovered from dataset WP-ω using RAxML and IQ-TREE; (B–D) phylogenetic relationships inferred from datasets NCS, PCS and PCS-ω respectively using RAxML and IQ-TREE; (E) phylogenetic relationships based on matK and trnK intron using PAUP (MP tree) summarized from figure 3 in Kurashige et al. (2001); (F) phylogenetic relationships based on trnK using MrBayes and IQ-TREE summarized from figure 1 in Khan et al. (2021); (G) phylogenetic relationships based on 38 plastid genes using IQ-TREE summarized from figure S3 in Xia et al. (2022); (H) phylogenetic relationships based on nine chloroplast genes plus ITS and RPB2-I regions using BEAST summarized from supporting information appendix S5 in Shrestha et al. (2018); (I) phylogenetic relationships based on ITS using PAUP (MP tree) summarized from figure 1 in Gao et al. (2002); (J) phylogenetic relationships based on RPB2-I using PAUP (MP tree) and MrBayes summarized from figure 2 in Goetsch et al. (2005); (K) phylogenetic relationships based on ITS using MrBayes and IQ-TREE summarized from figure 2 in Khan et al. (2021); (L) phylogenetic relationships based on 3437 nuclear orthologous genes using IQ-TREE and ASTRAL summarized from figures S1 and S2 in Xia et al. (2022).

