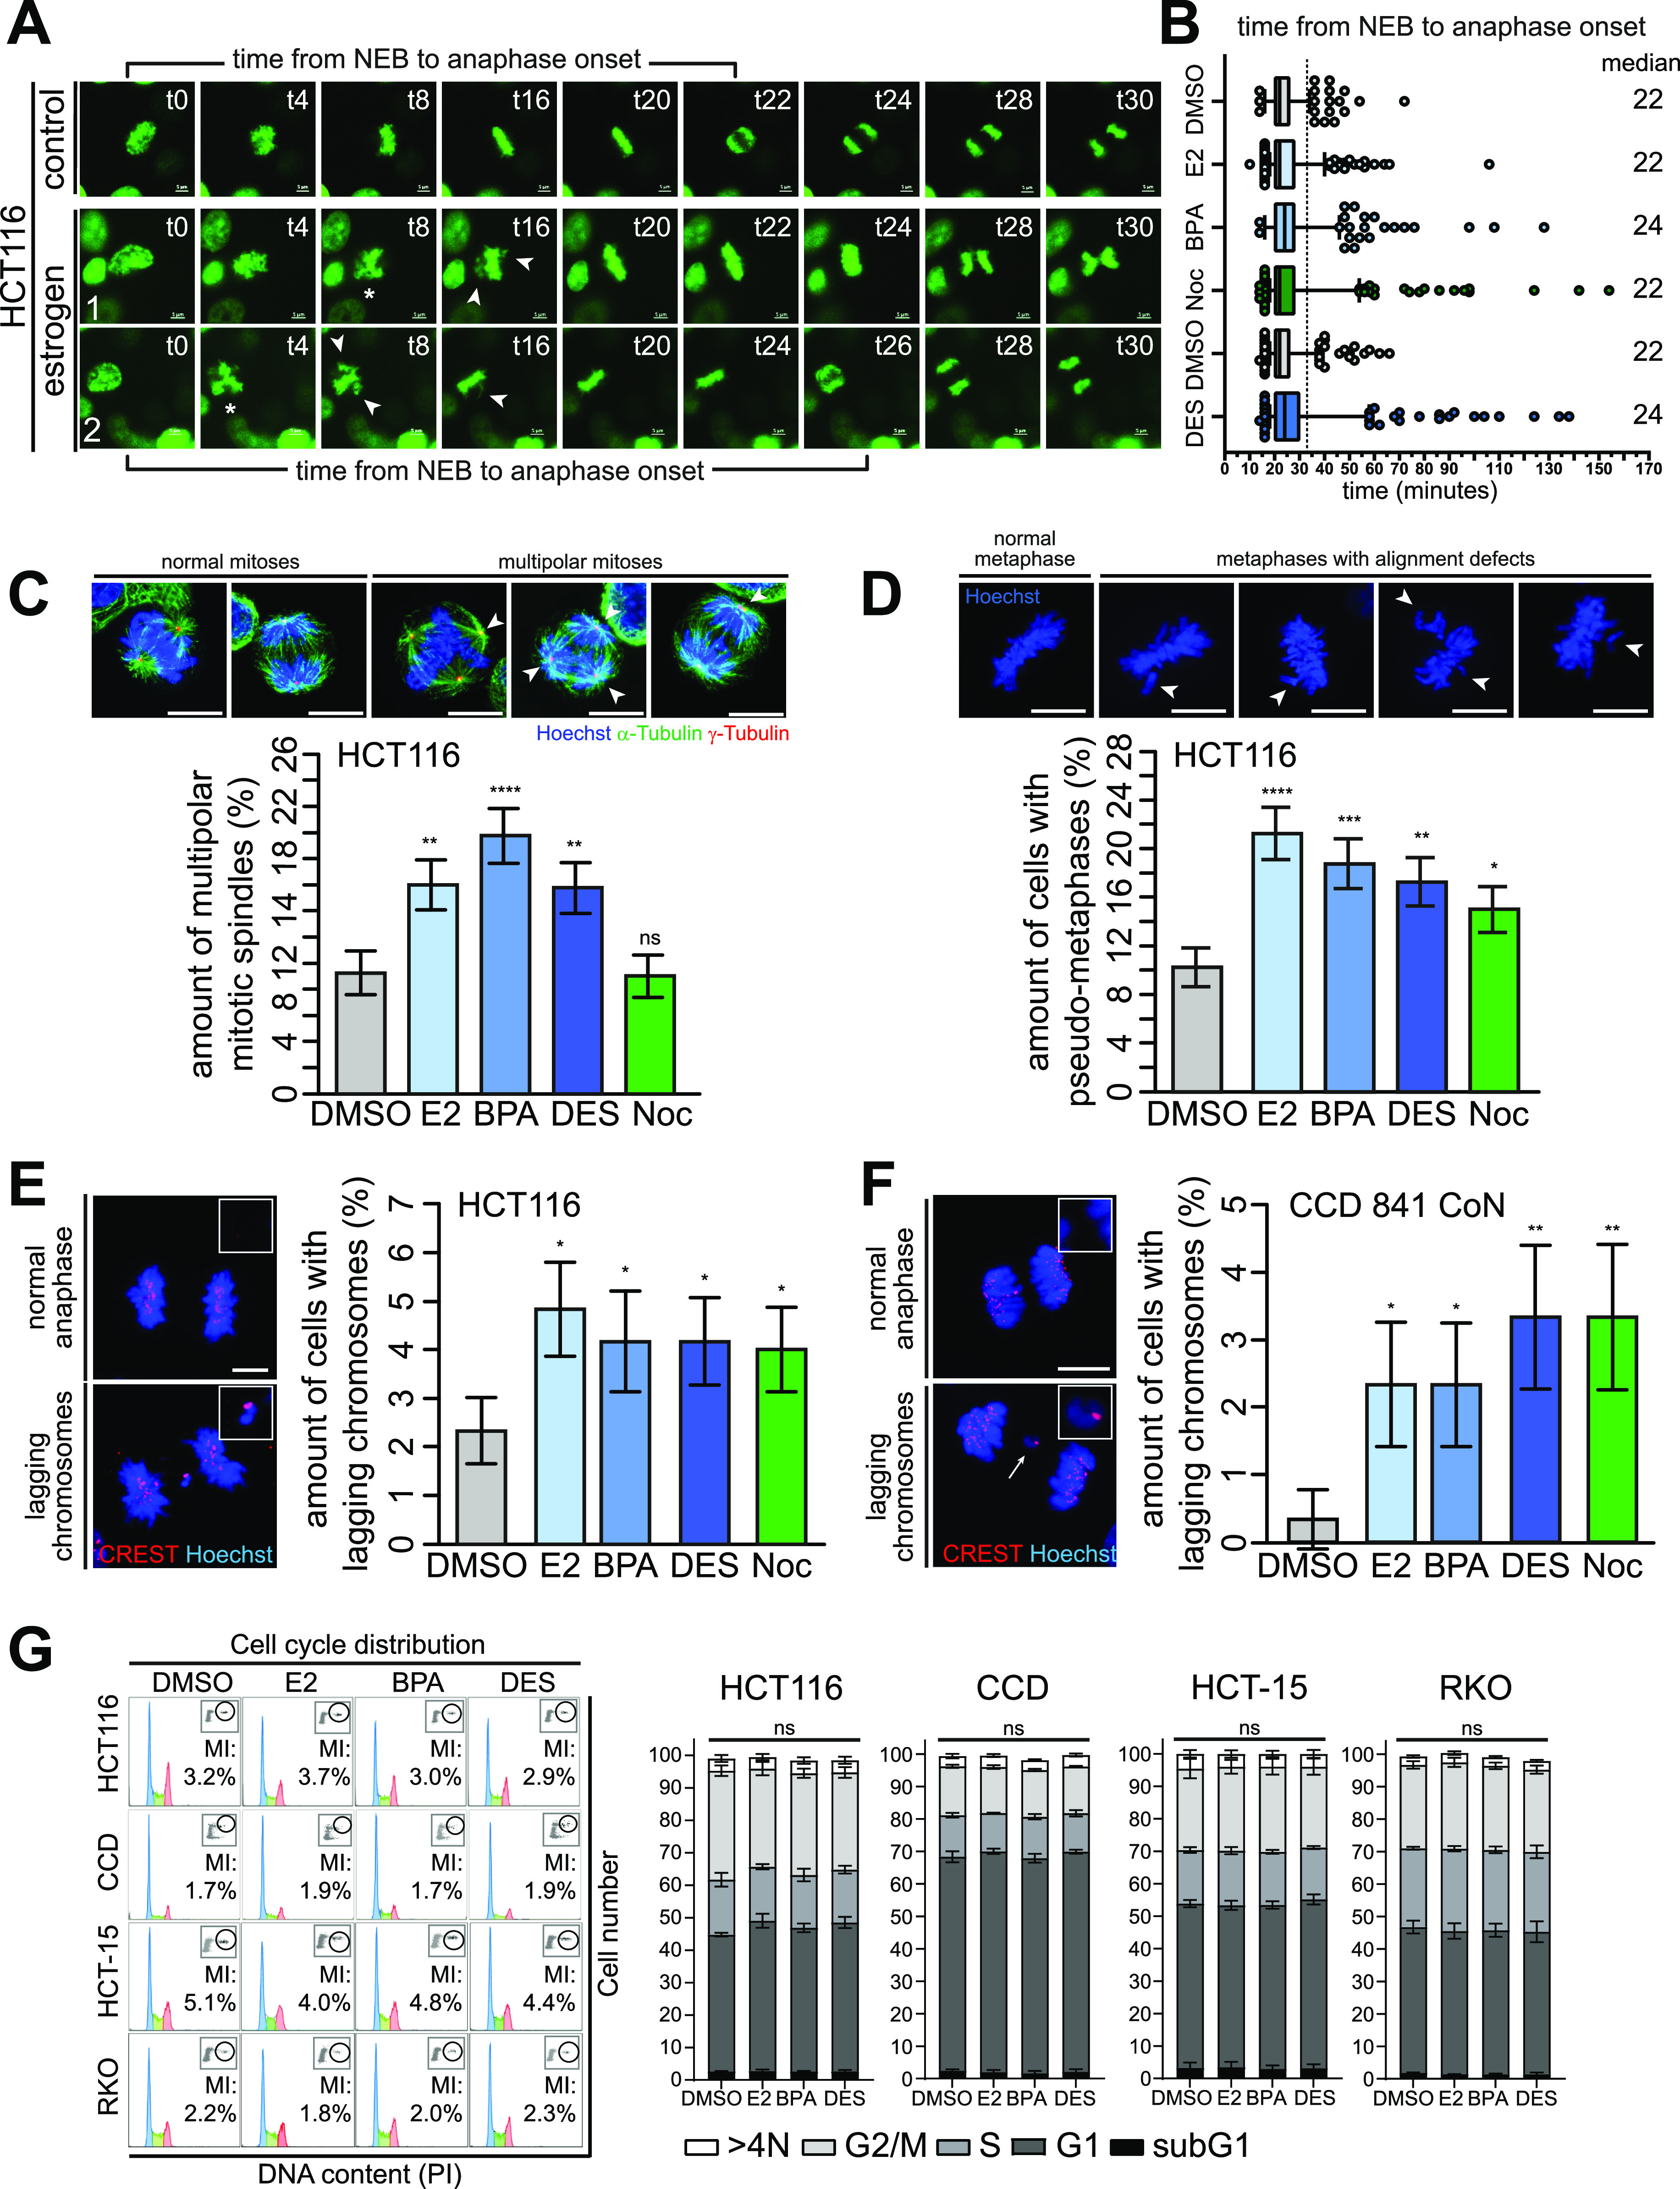
Figure 4. GPER1-activating estrogens induce multipolar mitoses and lagging chromosomes without altering cell cycle distribution.
(A, B) Disturbance of mitotic progression by treatment with (xeno)estrogens. (A) HCT116 cells expressing GFP-tagged histone H2B were treated with DMSO, or 10 nM 17β-estradiol, bisphenol A, or diethylstilbestrol, or 5 nM nocodazole (Noc) for 40 h after live-cell imaging for 8 h under continuous treatment. Still frames were shown from time-lapse movies of representative cells treated with DMSO, bisphenol A (#1), or diethylstilbestrol (#2). Images were captured every 2 min to monitor mitotic progression. Stars point to cells with multipolar chromosome arrangement, and arrowheads, to unaligned chromosomes (t = time in minutes). Scale bars, 5 μm. (B) Time from nuclear envelope breakdown to anaphase onset was determined from (xeno)estrogen-treated (10 nM each) and Noc-treated (5 nM) cells (median, box and whiskers, 5–95 percentile, n = 4 with a total of 400 cells). (C, D) Detection and quantification of HCT116 cells with multipolar spindles (C) and pseudo-metaphases (D). Cells treated as in (A) were synchronized in mitosis with a double thymidine block as described in (9). Representative immunofluorescence images show cells with or without multipolar mitotic spindles (C) or chromosome alignment defects (D) (chromosomes, Hoechst 33342, blue; centrosomes, γ-tubulin, red; spindles, α-tubulin, green; scale bar, 10 μm). Arrowheads mark extra centrosomes (C) and unaligned chromosomes of pseudo-metaphases (D). The graphs show the quantification of the proportion of cells exhibiting the respective mitotic defect as indicated (mean ± s.d., n = 4 with a total of 400 cells). Wald’s z-statistics computed by the R function glmmTMB was used to calculate the P-value. ns, not significant; (*P < 0.05; **P < 0.01; ***P < 0.001; and ****P < 0.0001). (E, F) Detection and quantification of anaphase cells with lagging chromosomes. Colon (cancer) cells were treated as in (A) and synchronized in the anaphase of mitosis with a double thymidine block as described in (9) (HCT116, (E)) or left grown asynchronously for 48 h (CCD 841 CoN, (F)). Representative immunofluorescence images with or without lagging chromosomes are shown (chromosomes, Hoechst 33342, blue; kinetochores, CREST, red; scale bar, 10 μm). Insets show lagging chromosomes at higher magnification. Only kinetochore-positive chromosomes were counted as lagging chromosomes (arrows). Graphs show the quantification of the proportion of cells exhibiting lagging chromosomes (mean ± s.d., (D) n = 6 with a total of 600 cells, Wald’s z-statistics computed by the R function glmmTMB was used to calculate the P-value, and (E) n = 3 with a total of 300 cells). The bootstrap procedure was used to calculate the P-value. (*P < 0.05 and **P < 0.01). (G) Representative FACS histograms (left) of HCT116, CCD 841 CoN (CCD), HCT-15, and RKO cells treated as in (A) for 48 h showing cell cycle distribution and mitotic indices (MI) of propidium iodide and MPM2–co-immunostained cells. Blue, G1 phase; green, S phase; and red, G2 phase. The graphs (right) show the quantification of the amount of cells in the subG1 area, and G1, S, or G2 phase based on their DNA content (N). >4N = polyploid cells (mean ± SEM, n = 3 with a total of 30,000 cells, ordinary one-way ANOVA). A detailed description of statistics is provided in the Materials and Methods section.
P-values are available for this figure.