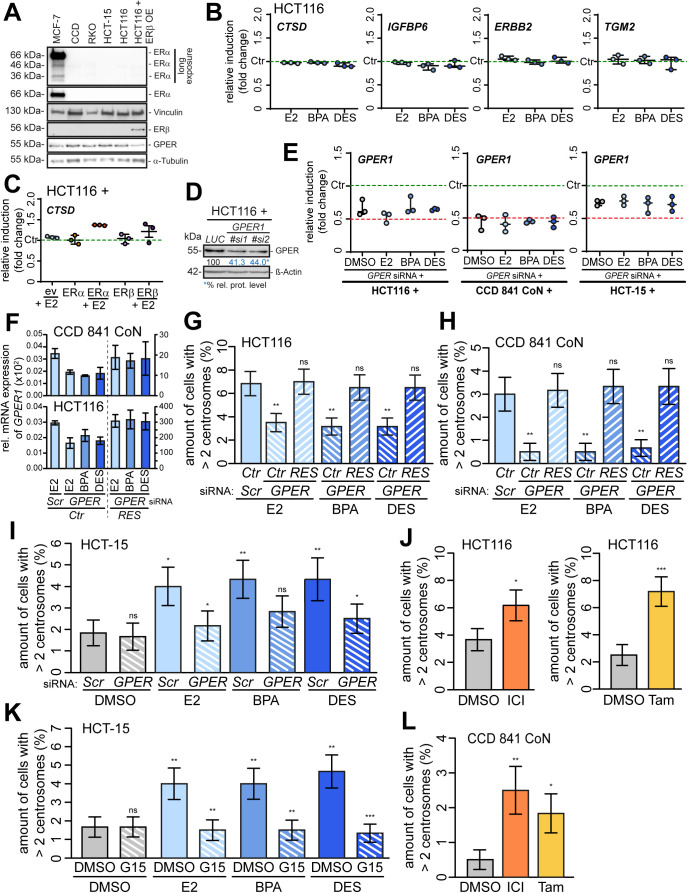
Figure S3. Confirmation of GPER1 but not ERα/β-specific centrosome amplification upon estrogen treatment.
(A) Western blot of ERα, ERα variants (long isoform, 66 kD; ER46, 48 kD; and ER36, 36 kD (22)), ERβ, and GPER1 protein in MCF-7, CCD 841 CoN, RKO, HCT-15, HCT116, and ERβ-expressing HCT116 cells. α-Tubulin and α-vinculin served as a control. (B) Expression of CTSD, IGFBP6, ERBB2, and TGM2 mRNA in HCT116 cells upon treatment with 17β-estradiol (E2), bisphenol A (BPA), or diethylstilbestrol (DES) for 48 h. mRNA expression was normalized to the housekeeper GAPDH and the control (DMSO). Each data point represents the median with 95% CI of three independent experiments. Values of the DMSO controls are the same for each gene. (C) Expression of CTSD mRNA in HCT116 control and ERα- or ERβ-expressing cells upon treatment with E2, BPA, or DES for 48 h. mRNA expression was normalized to the housekeeper GAPDH and the control (empty vector treated with DMSO). Each data point represents the median with 95% CI of three independent experiments. (D) Western blot of GPER1 protein in HCT116 cells in the presence or absence of GPER1 repression via gene-specific siRNA. Relative protein levels of GPER1 normalized to β-actin and the control (LUC) are shown. (E) Expression of GPER1 mRNA in HCT116 (left), CCD 841 CoN (middle), or HCT-15 cells (right) upon GPER1 repression via gene-specific siRNA and concomitant treatment with E2, BPA, or DES for 48 h. mRNA expression was normalized to the housekeeper GAPDH and the control (SCRAMBLED siRNA). Each data point represents the median with 95% CI of three independent experiments. (F) Relative mRNA expression of GPER1 was determined by quantitative real-time PCR using GPER1 primer #2, and normalized to the endogenous control GAPDH. Each bar represents the mean ± SD of three (HCT116) or two (CCD 841 CoN) experiments. Left axis: bars 1–4; right axis: bars 5–7. (G, H) Verification of the dependency on GPER1 and the specificity of the GPER1 knockdown in HCT116 (G) and CCD 841 CoN cells (H). Cells were co-transfected with control (SCR) or GPER1-specific siRNAs (GPER) and an empty vector (Ctr) or siRNA-resistant version of GPER1 (RES), and the amount of cells with more than two γ-tubulin signals at interphase centrosomes was quantified in the absence (DMSO) or presence of 10 nM E2, BPA, or DES treated for 48 h (mean ± s.d., n = 3 with a total of 600 cells). Wald’s z-statistics computed by the R function glmmTMB was used to calculate the P-value. ns, not significant; **P < 0.01. (I) Quantification of the amount of HCT-15 cells with more than two γ-tubulin signals at interphase centrosomes, upon GPER1 repression in the absence (DMSO) or presence of E2, BPA, or DES treated for 48 h (mean ± s.d., n = 3 with a total of 600 cells). ANOVA was used to calculate the P-value of DMSO + G15. Wald’s z-statistics computed by the R function glmmTMB was used to calculate the P-value of the remaining treatments. ns, not significant; *P < 0.05 and **P < 0.01. (K) HCT-15 cells were pretreated with 100 nM G15 for 30 min before additional exposure to DMSO, 10 nM E2, BPA, or DES for 48 h, and the amount of cells with more than two γ-tubulin signals at interphase centrosomes was quantified (mean ± s.d., n = 3 with a total of 600 cells). ANOVA was used to calculate the P-value of DMSO + G15. Wald’s z-statistics computed by the R function glmmTMB was used to calculate the P-value of the remaining treatments. ns, not significant; **P < 0.01 and ***P < 0.001. (J) HCT116 cells were treated with ICI182780 (ICI) or tamoxifen (Tam) for 48 h, and the amount of cells with more than two γ-tubulin signals at interphase centrosomes was quantified (mean ± s.d., n = 3 with a total of 600 cells). Wald’s z-statistics computed by the R function glmmTMB was used to calculate the P-value. *P < 0.05 and ***P < 0.001. (L) CCD 841 CoN cells were treated with ICI182780 (ICI) or tamoxifen (Tam) for 48 h, and the amount of cells with more than two γ-tubulin signals at interphase centrosomes was quantified (right panel) (mean ± s.d., n = 3 with a total of 600 cells). Values for DMSO are the same as for DMSO in Fig 2F. Wald’s z-statistics computed by the R function glmmTMB was used to calculate the P-value. *P < 0.05 and **P < 0.01. A detailed description of statistics is provided in the Materials and Methods section.
P-values are available for this figure.

