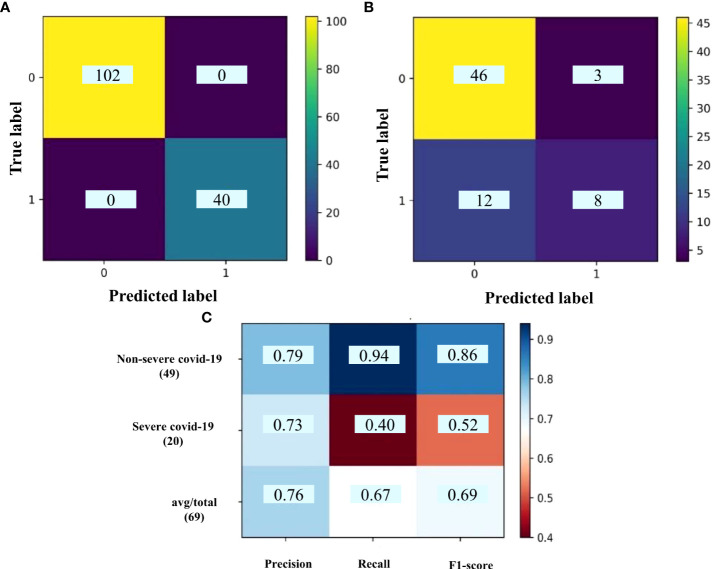
Figure 7.
The confusion matrix of (A) train set and (B) test set; (C) classification report for DE_Smodules of brown. The confusion matrix shows the number of true and predicted label in non-severe COVID-19 (label 0) and severe COVID-19 (label 1) subjects. The classification report demonstrates the precision, recall, and F1-score for each group.

