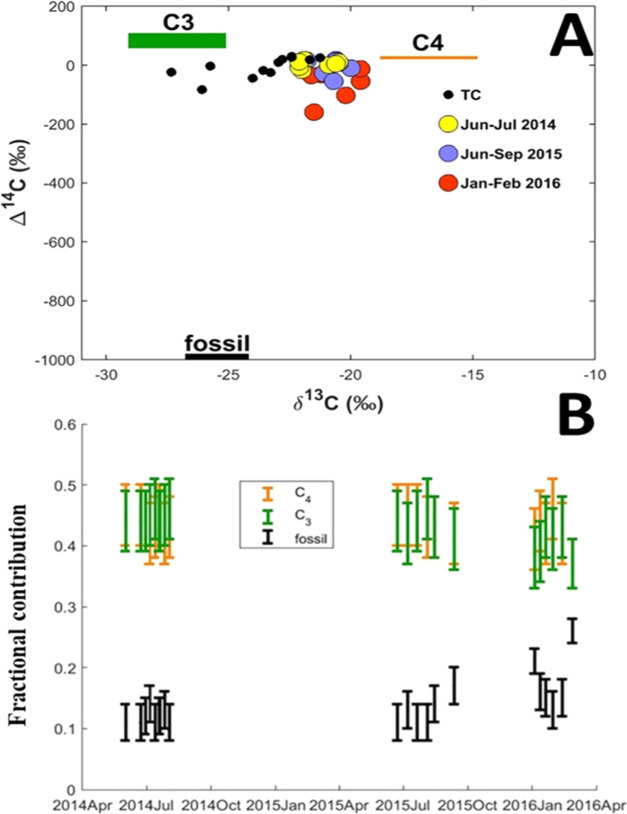
Figure 4.
Dual-carbon (Δ14C and δ13C)-based source apportionment of BC at Rwanda Climate Observatory. (A) Dual-isotope signatures of BC for dry period PM2.5 aerosols. Colored circles represent the isotope signatures for BC for the study period (color represents time period), while black dots represent the isotope signatures for total carbon (TC = EC + OC) from October to November 2014 and May to September 2015.1 (B) Relative source contributions (means and standard deviations), computed using eq 2.

