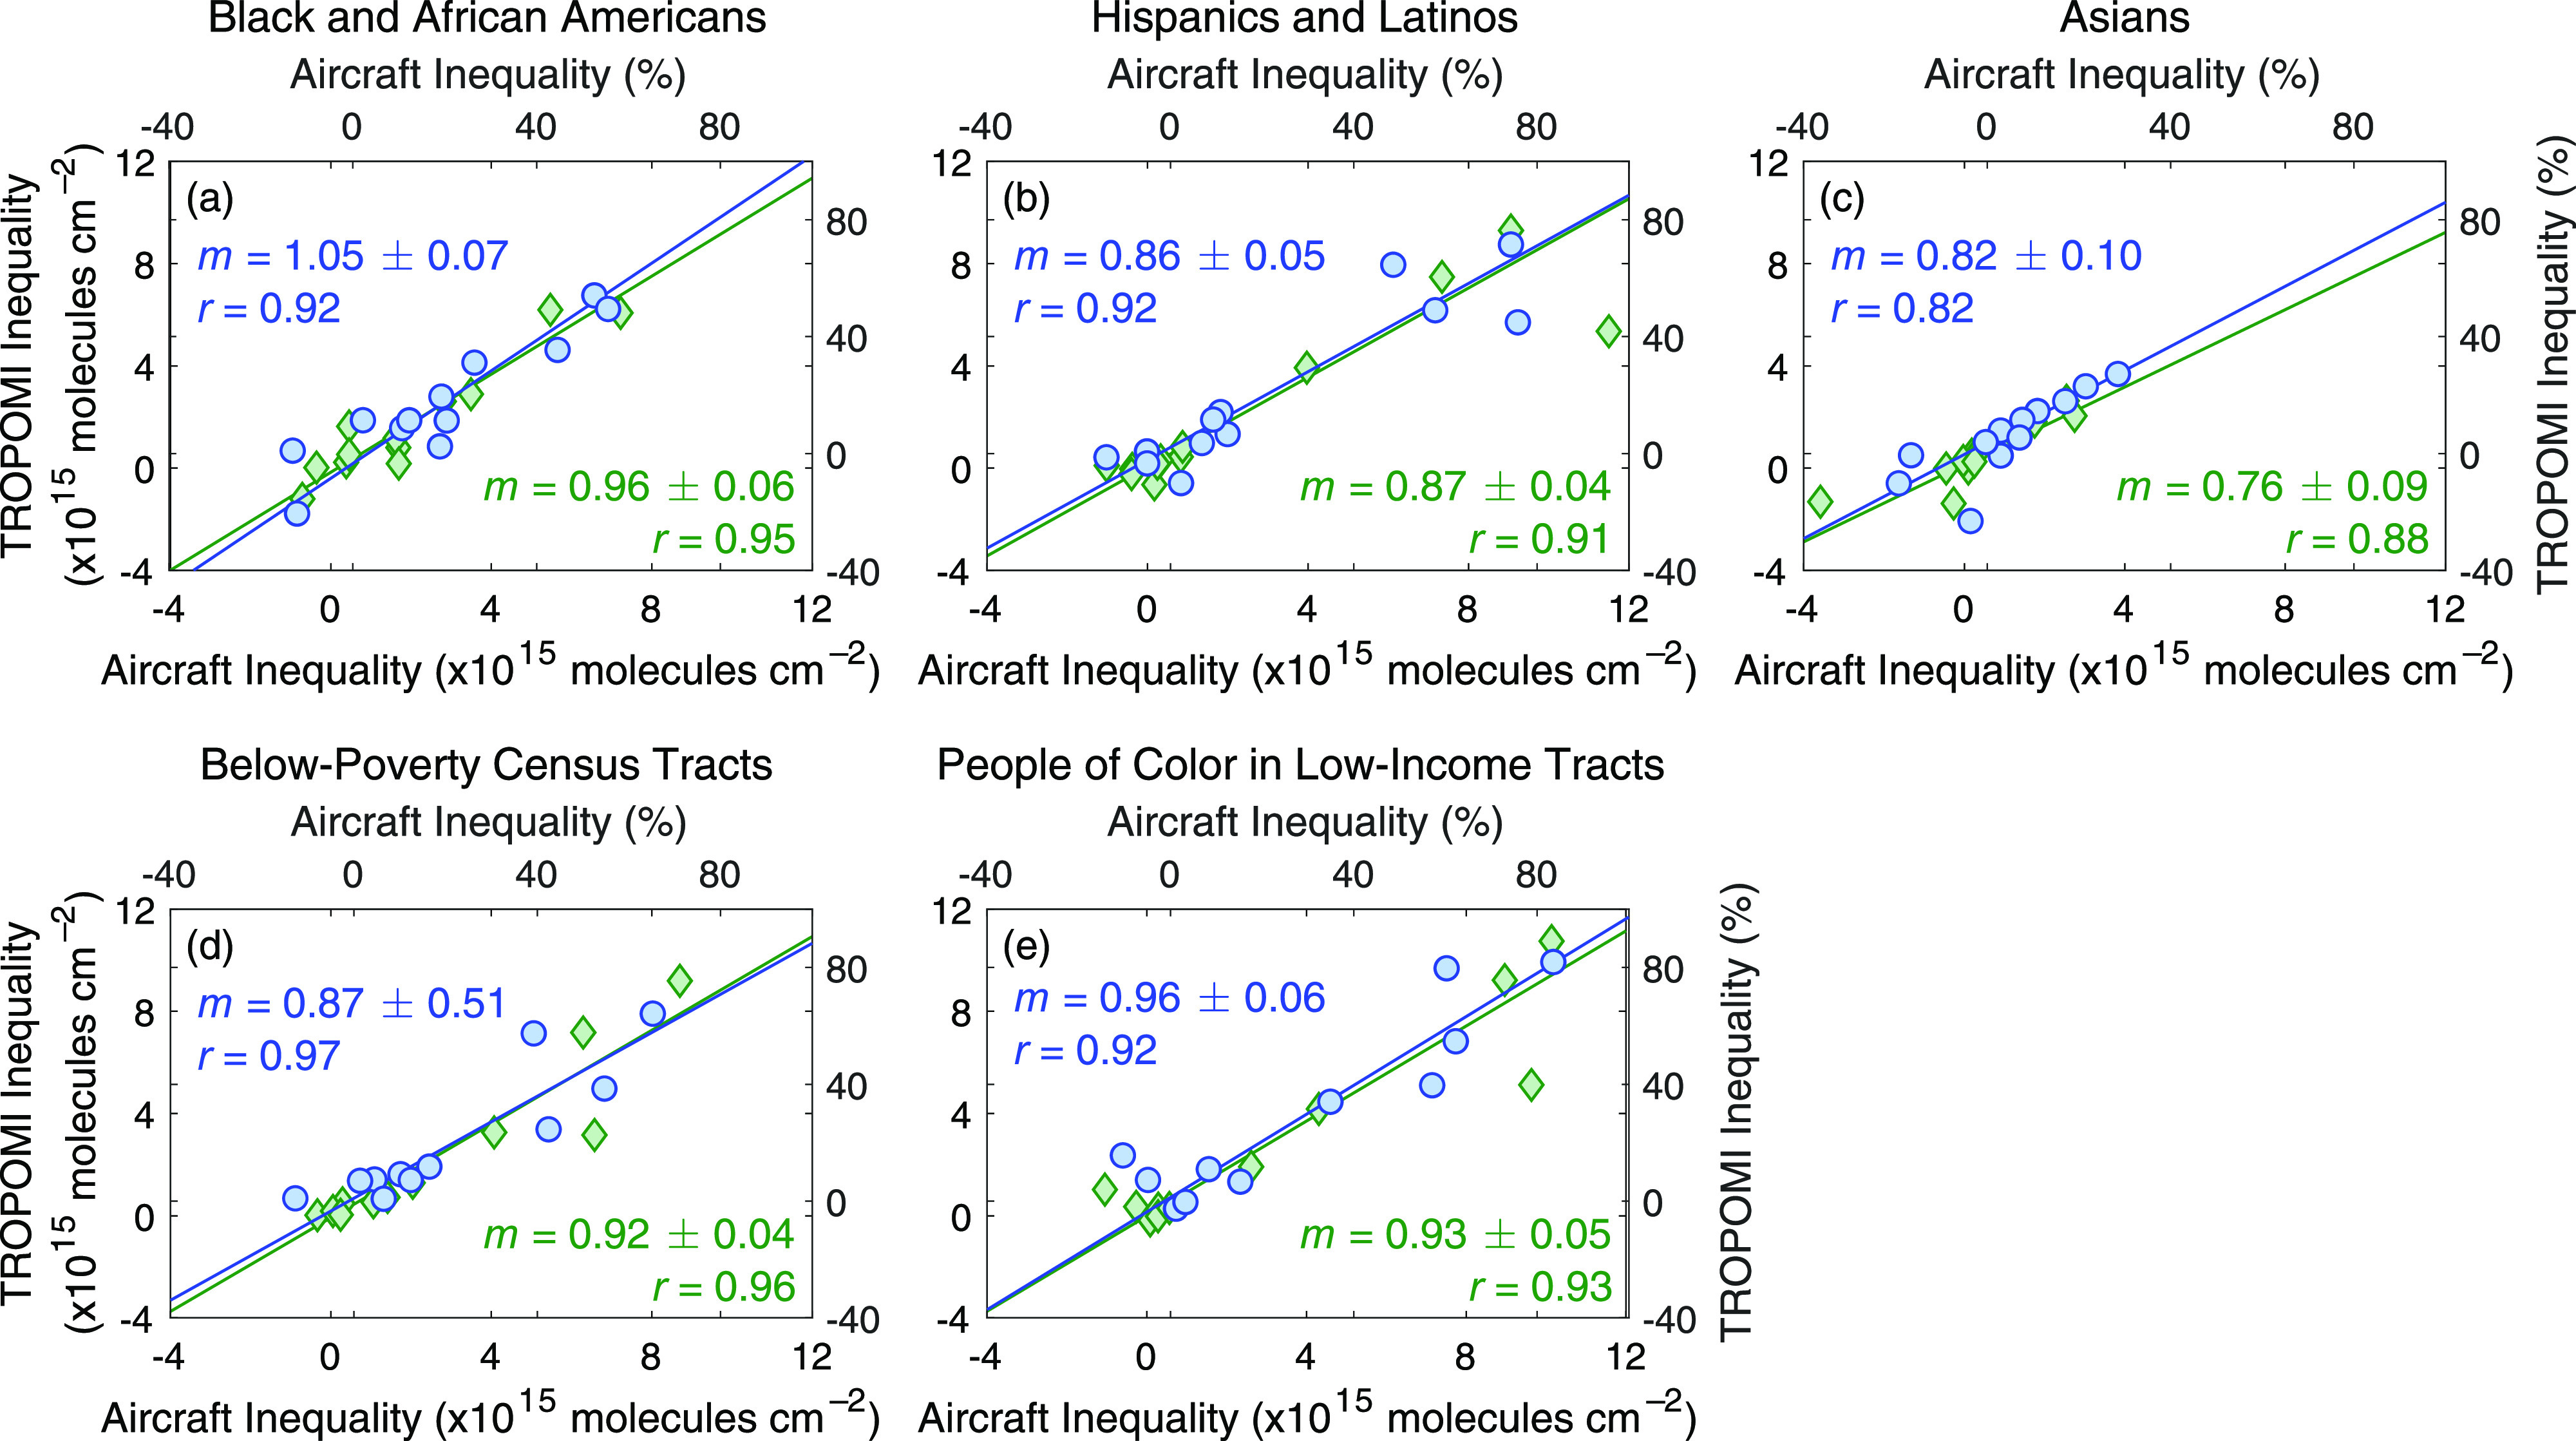
Figure 4.

Daily relative (%) (blue circles) and absolute (molecules cm–2) (green diamonds) inequalities measured by GCAS and GeoTASO vs TROPOMI during LISTOS for Black and African Americans (a), Hispanics and Latinos (b), and Asians (c) compared to those for non-Hispanic/Latino whites, below-poverty vs above poverty tracts (d), and LIN compared to HIW tracts (e). Fits are derived from an unweighted bivariate linear regression model. Slopes (m) and Pearson correlation coefficients (r) for each fit are reported for both relative (blue) and absolute (green) inequalities. One data point in panel d is out of frame (−119.5%, −136.4%).
