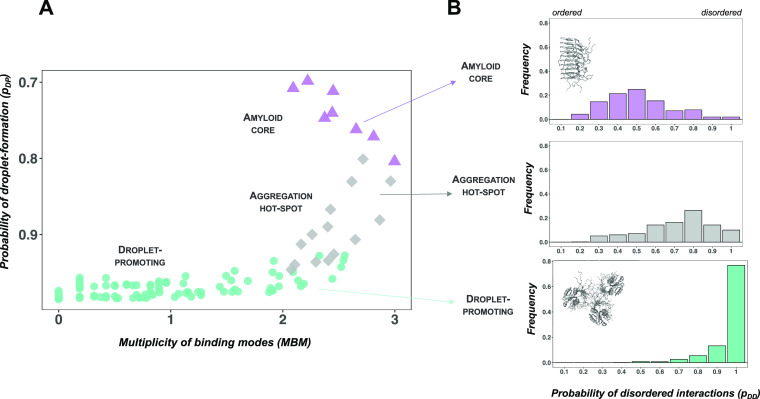
Figure 2.
Droplet landscape representation of the LC region of TDP-43. (A) Droplet landscape of the LC region of TDP-43 (residues 262–414). The x axis of the droplet landscape corresponds to the multiplicity of binding modes (MBM).22 The y axis of the droplet landscape is defined by the droplet-promoting propensity (pDP).6 The droplet landscape of the wild-type TDP-43 LC domain (residues 262–414) illustrates droplet-promoting residues (residues 262–311 and 342–414, green circles) in the lower-left section of the droplet landscape with high pDP values and low MBM values. In contrast, residues forming the amyloid core (residues 321–330, purple triangles) are in the upper-right section, exhibiting low pDP values and high MBM values. Regions that readily convert into amyloids (i.e., “aggregation hot-spots”, residues 312–320 and 331–341, gray diamonds19) are in the lower cross section, with high pDP values and high MBM values. These residues prefer disordered binding configurations, as well as also sample ordered states, as reflected by high interaction multimodality. (B) Frequencies of different binding modes in the TDP-43 LC domain. The frequencies of different binding modes from ordered to disordered interactions are shown for the amyloid core (purple), aggregation hot-spot (gray), and droplet-promoting region (green). While the amyloid core and the aggregation hot-spot exhibit wide distributions by sampling both the ordered and disordered interactions, leading to high MBM, the droplet region mostly samples disordered (unimodal) interactions, leading to low MBM.

