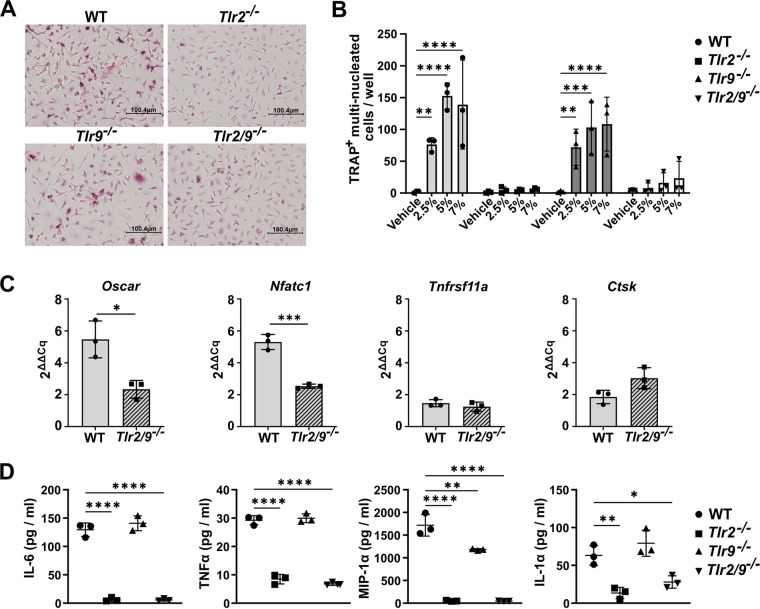
FIG 1.
S. aureus supernatants promote osteoclastogenesis in RANKL-primed precursors through TLR2. (A and B) Bone marrow-derived monocytes (BMDMs) were isolated from wild type (WT), Tlr2−/−, Tlr9−/−, and Tlr2/9−/− mice and were cultured with 35 ng/mL RANKL + CMG 14-12 supernatant for 2 days. RANKL-primed osteoclast precursors were stimulated with the indicated vol/vol percentage of supernatant from the Δpsmα1-4 strain of S. aureus or vehicle control in media containing CMG 14-12 supernatant but lacking RANKL. After 4 more days of culture, the cells were stained for tartrate-resistant acid phosphatase (TRAP), and TRAP+ multinucleated (≥3 nuclei) osteoclasts were quantified. (A) Representative images of the 5% treatment condition were obtained at 20× magnification. (B) Osteoclast counts were evaluated via two-way analyses of variance (ANOVA), and the counts from each genotype were compared to the vehicle via Dunnett’s multiple-comparisons test. **, P < 0.01; ***, P < 0.001; ****, P < 0.0001. If not denoted with asterisks, the differences between treatments were not statistically significant. Error bars denote the standard deviation (SD). The results are representative of three biological replicate experiments with n = 3 technical replicates plotted. (C) BMDMs were primed with 35 ng/mL RANKL and CMG 14-12 supernatant for 2 days and then stimulated with 7.5% supernatant from Δpsmα1-4 or with vehicle for 24 h in media without RANKL. Cell lysates were collected, and transcript levels were measured using RT-qPCR. ΔΔCq values were compared between genotypes using t tests. *, P < 0.05; ***, P < 0.001. If not denoted with asterisks, the differences between genotypes were not statistically significant. Error bars denote the SD. The results are representative of two biological replicates with n = 3 technical replicates per group. (D) BMDMs were cultured in 35 ng/mL RANKL + CMG 14-12 supernatant for 2 days. RANKL-primed osteoclast precursors were stimulated with 7% Δpsmα1-4 Δspa supernatant in the absence of RANKL. The cell culture supernatants were collected after 12 h of stimulation. Cytokine abundance was measured using Luminex technology. Cytokines were compared across genotypes using one-way ANOVAs, and Dunnett’s multiple-comparisons test was used to compare between WT and knockout genotypes. *, P < 0.05; **, P < 0.01; ****, P < 0.0001. If not denoted with asterisks, the differences between genotypes were not statistically significant. Error bars denote the standard deviation (SD). Results represent one biological replicate with n = 3 technical replicates per group.

