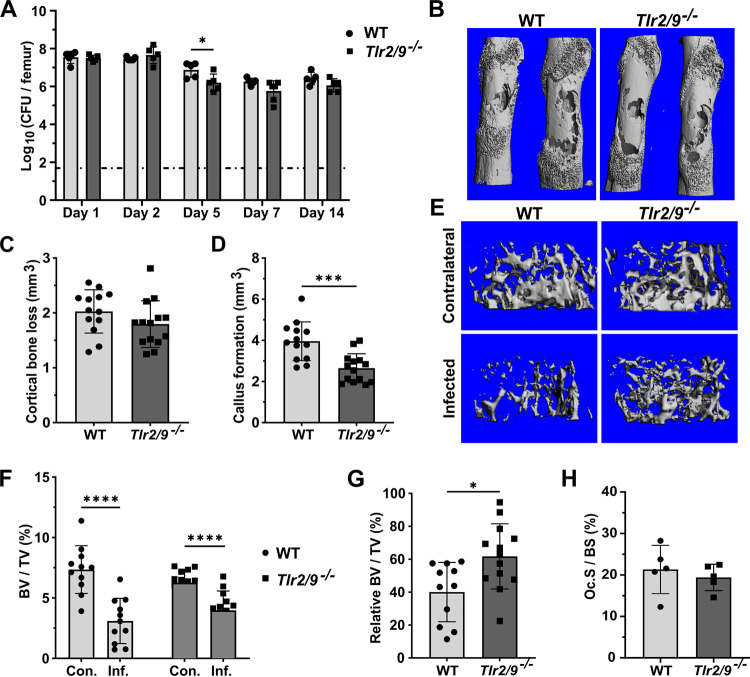
FIG 4.
Combined TLR2- and TLR9-deficiency limits infection-induced trabecular bone loss and callus formation. (A–H) WT and Tlr2/9−/− mice were subjected to osteomyelitis via intraosseous injection of 106 CFU of S. aureus. For all graphs, error bars denote the SD. (A) Femurs were collected for CFU enumeration on the indicated days postinfection. The dotted line indicates the Log10 transformed limit of detection. The Log10 CFU burdens were compared between genotypes using unpaired t tests (days 2, 5, and 14) or Mann-Whitney U tests (days 1 and 7), depending on data normality. For days 1, 2, 5, and 14, n = 5 per genotype, and n = 6 for day 7. *, P < 0.05. (B–H) Mice were euthanized on day 14 postinfection, and the infected and contralateral femurs were isolated. Bone parameters were assessed using μCT. The results are pooled from independent experimental replicates. For cortical bone, n = 13 for the WT, and n = 14 for the Tlr2/9−/− mice. For trabecular bone, n = 11 for the WT mice, and n = 13 for the Tlr2/9−/− mice. If not denoted with asterisks, the differences between genotypes were not statistically significant. (B) Representative 3D images of infected femurs were constructed using μCT. (C) Cortical bone loss was compared between genotypes using an unpaired t test. (D) Callus formation was compared between genotypes using an unpaired t test. (E) Representative images of trabecular bone in infected and contralateral femurs were constructed by uCT. Images represent the median infected femur %-BV/TV. (F) %-BV/TV values were analyzed by a repeated measures two-way ANOVA. ****, P < 0.0001 for limb type, P = 0.08729 for genotype, and ***, P = 0.004 for genotype × limb type. Sidak’s test was used to compare the %-BV/TV of the infected and contralateral limbs within genotypes. ****, P < 0.0001. (G) The infected femur BV/TV was normalized to the contralateral BV/TV, and the genotypes were compared using an unpaired t test, *, P = 0.0109. (H) Histomorphometry was performed on TRAP-stained femur sections to measure TRAP+ cell surface on trabecular bone, relative to total trabecular volume. %-osteoclast surface/bone surface (Oc.S/BS) was compared between genotypes using a Mann-Whitney U test.

