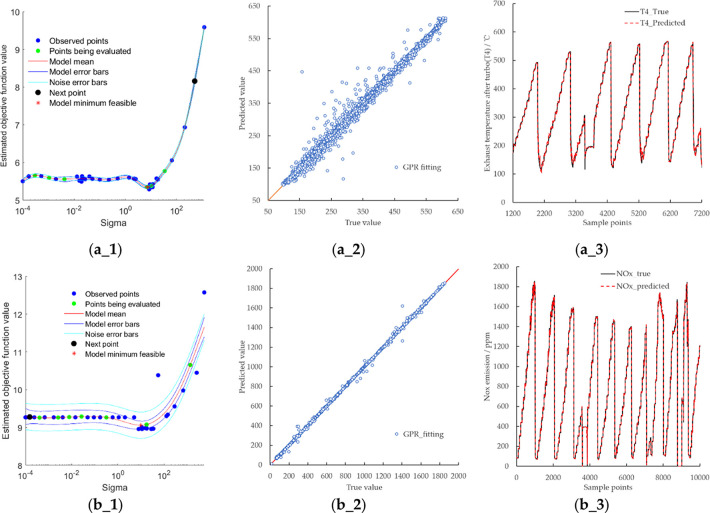
Figure 9.
Fitting results of T4, NOx, and soot: (a_1) change of T4 objective function value with sigma; (a_2) deviation plot of predicted and actual values of T4; (a_3) comparison of predicted and actual T4 values; (b_1) change of the NOx objective function value with sigma; (b_2) deviation plot of predicted and actual values of NOx raw emissions from engine; (b_3) comparison of predicted and actual NOx values.

