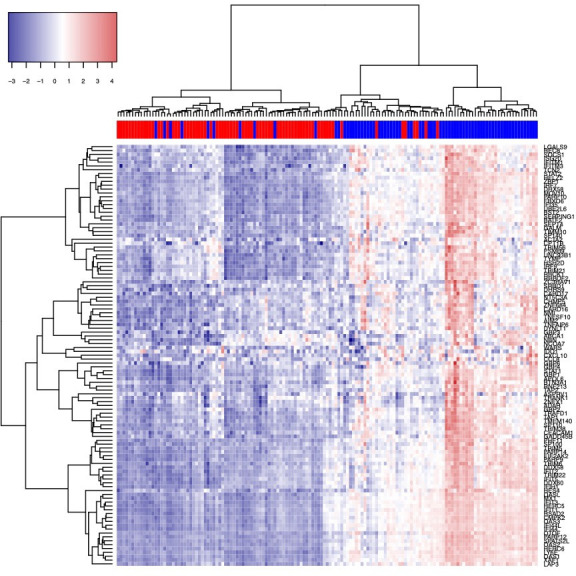
Figure 2.

Heat map of expression of 110 interferon-stimulated genes43 in SLE compared with HC. Subjects with SLE indicated by blue in the colour bar above the map, and HC indicated by red. ‘Pheatmap’ package V.1.0.121 is applied on DESeq2 normalised and variance stabilised gene expression values to create the heat map.62 HC, healthy control.
