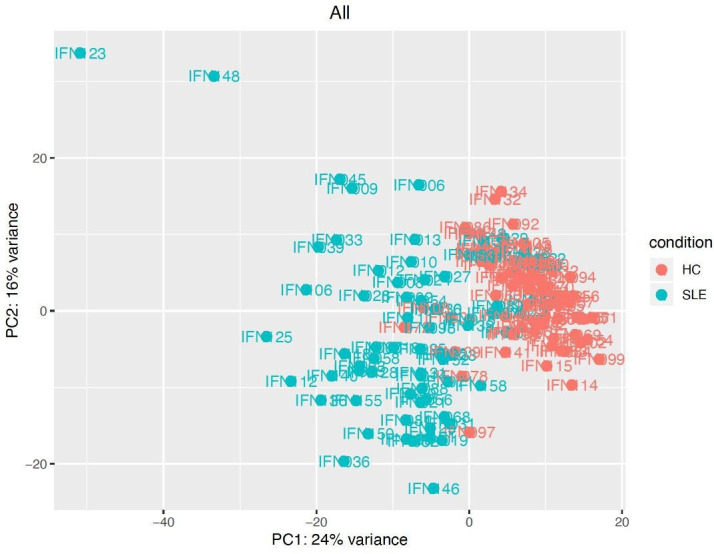
Figure 3.

PCA of gene expression in SLE compared with HC. PCA conducted on DESeq2 normalised, and variance stabilised gene expression values, using the function prcomp in R V.3.5,1 is displayed. The default top 500 most highly variant genes were selected.63 HC, healthy control; PCA, principal component analysis.
