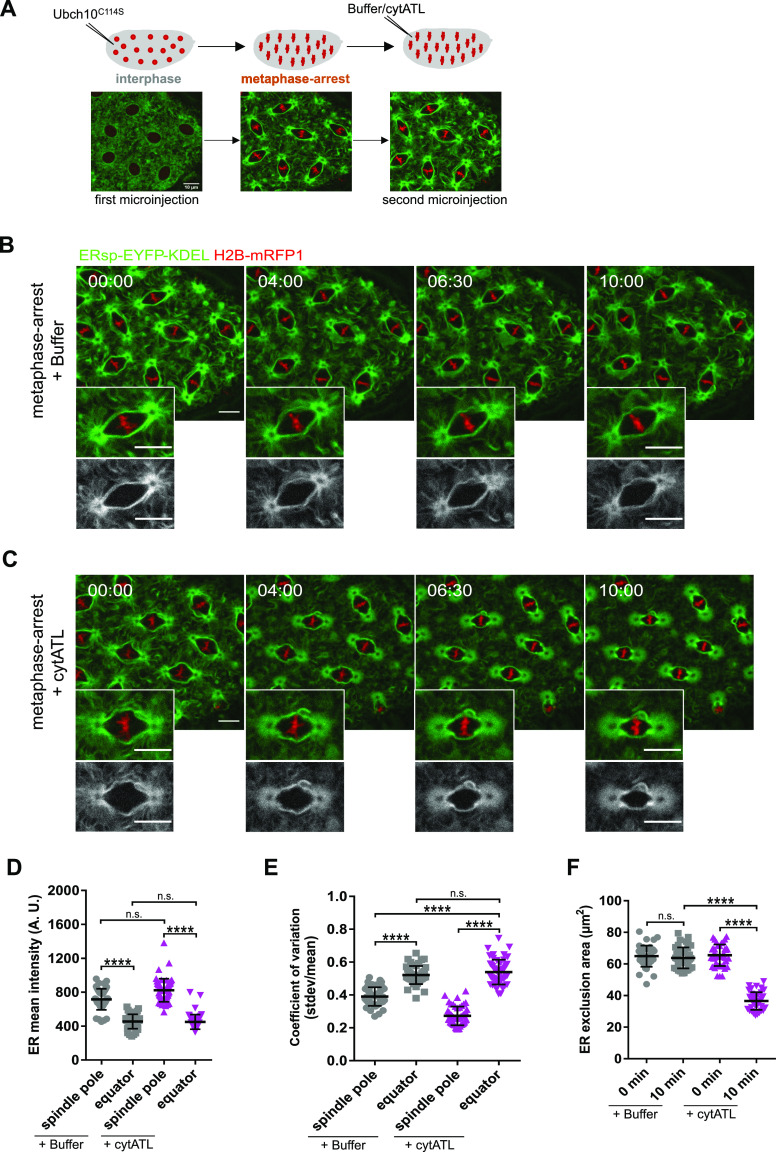
Figure 3. Acute ER disruption is achieved by ectopic addition of cytATL.
(A) Experimental layout for acute ER disruption: embryos were arrested in metaphase by microinjection with UbcH10C114S and allowed to reach chromosome alignment. After arrest (∼5 min) embryos were subjected to a second microinjection. ER dynamics was monitored by ERsp-EYFP–KDEL (green) and chromatin by H2B–mRFP1 (red). (B, C) Stills depicting changes in ER morphology (ERsp-EYFP–KDEL, green) after microinjection of buffer (B) or the dominant-negative cytATL protein (C) in metaphase-arrested embryos; time (min:s) is relative to the second microinjection (buffer/cytATL). Grey panels depict ER channel alone. Scale bar is 10 μm. (D) Quantitative analysis of the mean fluorescence intensity of ERsp-EYFP–KDEL in spindle poles or equatorial regions 10 min after buffer/cytATL injection. (E) Coefficient of variation, that is, the ratio of stdev over the mean, 10 min after buffer/cytATL injection. (F) ER exclusion area in control (buffer injected, grey) and cytATL (magenta) conditions at the first (t = 0 min) and last (t = 10 min) time point of the time-lapse. Statistical analysis using N = 10 embryos, n = 5 nuclei per embryo. (D, E, F) Asterisks represent statistical significance derived from Kruskal–Wallis (Dunn’s multiple comparisons test) (D) or one-way ANOVA (E, F), multiple comparisons, P value adjusted to multiple comparisons (Tukey). ****P < 0.0001, n.s., nonsignificant, P > 0.05.
Source data are available online for this figure.

