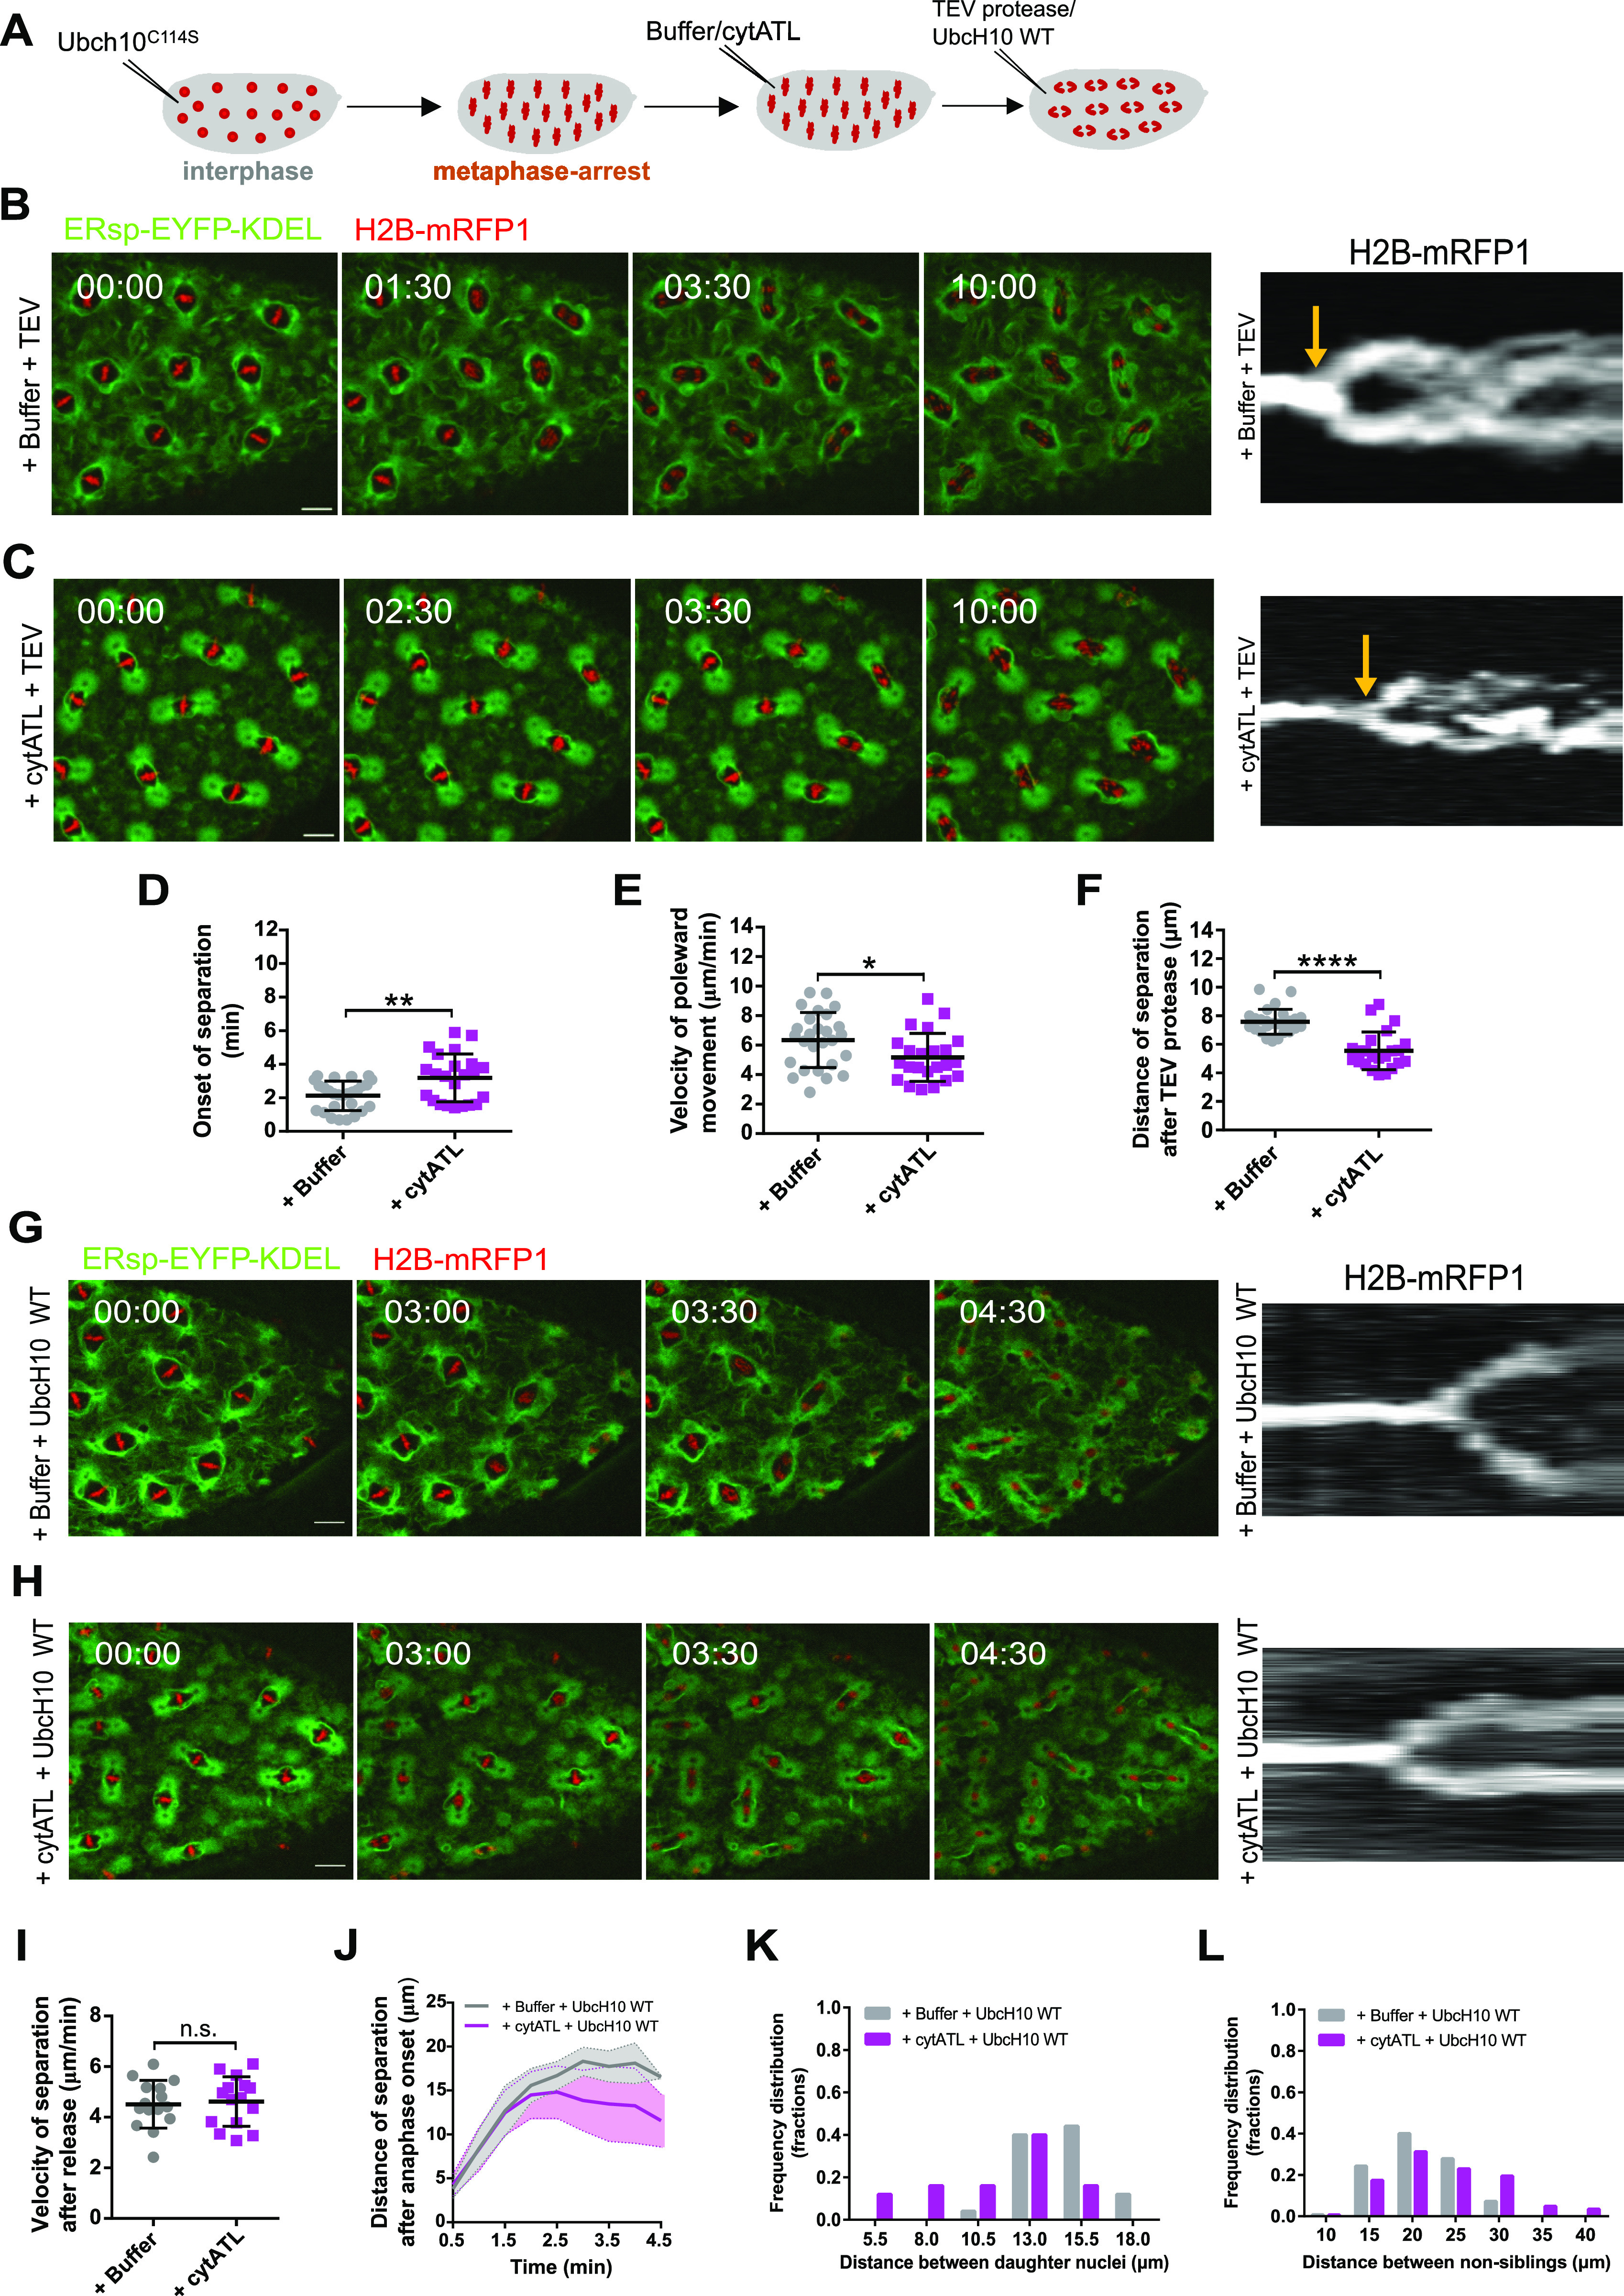
Figure 5. Spindle function is impaired upon cytATL-mediated ER disruption.
(A) Experimental layout: embryos were arrested in metaphase (UbcH10C114S microinjection), followed by microinjection with buffer/cytATL. After 10 min, embryos were subjected to a third microinjection with either TEV protease, to induce acute sister chromatid separation, or UbcH10WT to trigger mitotic exit. Embryos surviving solely on a TEV-cleavable version of Rad21 (Cohesin) were used for these experiments. (B, C) Time-lapse images from embryos after microinjection with buffer/cytATL and subsequently microinjected with TEV protease to trigger cohesin cleavage (+buffer+TEV, B; +cytATL+TEV, C); ER is labelled in green (ERsp-EYFP–KDEL) and chromosomes in red (H2B–mRFP1); scale bar is 10 μm; time (min:s) is relative to microinjection with TEV; kymographs (right panel) depict chromosome positioning over time; arrows highlight the onset of chromatid separation. (D, E, F) Quantification of the onset of separation (D), velocity of poleward movement (E), and distance of chromatid separation (F) induced by cohesin cleavage (+TEV), in conditions with intact ER (+buffer) or disrupted ER (+cytATL). Sample size: N = 5 embryos, n = 5 different nuclei for each experimental condition. (G, H) Time lapse images of induced anaphase in unperturbed ER (G, +buffer+UbcH10WT) and perturbed ER (H, +cytATL+UbcH10WT) conditions; ER is labelled in green (ERsp-EYFP–KDEL) and chromosomes in red (H2B–mRFP1); scale bar is 10 μm; time (min:s) is relative to microinjection with UbcH10WT; kymographs (right panel) depict chromosome positioning over time; (I, J) Quantification of the velocity of chromosome separation (H) and distance of chromosome separation (J) triggered upon artificial induction of anaphase (UbcH10WT) in embryos previously injected with buffer or cytATL. Sample size: N = 5 embryos, n = 3 different nuclei for each experimental condition. (K, L) Frequency distributions of distance between daughter nuclei (K) and between non-sibling nuclei (L) measured 3 min after anaphase onset; sample size: three to four measurements in N = 5 embryos (K) and six measurements in N = 5 embryos (L). (D, E, F) Asterisks refer to statistical significance, derived from unpaired t tests (two-sided) (D, E), nonparametric Mann–Whitney test (F) *P < 0.05, **P < 0.01, ***P < 0.001, ****P < 0.0001, n.s., nonsignificant, P > 0.05.
Source data are available online for this figure.

