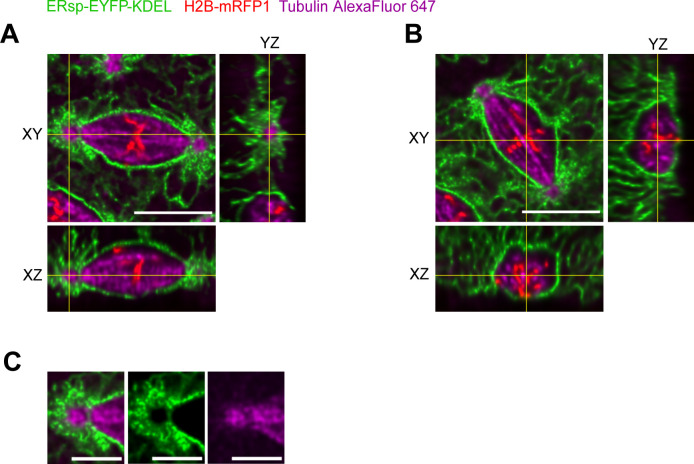
Figure S2. Orthogonal sections of nuclei to visualize the localization of the ER relative to the spindle pole.
Embryos expressing ERsp-EYFP-KDEL and H2B-mRFP1 were microinjected with Alexa647-labelled tubulin to visualize the spindle MTs. A z-stack acquired in Nyquist sampling in z (10 μm, 51 slices, z step size = 0.22 μm) was used to improve image resolution and deconvolution. Deconvolution was performed using Huygens software. (A) Orthogonal slices from the spindle pole region are depicted (yellow lines); scale bar is 10 μm. (B) Orthogonal slices from the middle plane of the spindle are depicted, showing the ER envelope surrounding the spindle; scale bar is 10 μm. (C) Zoom of the spindle pole region indicating lower ER intensity at the point connecting the spindle pole to the spindle body (XY, YZ); scale bar is 5 μm.

