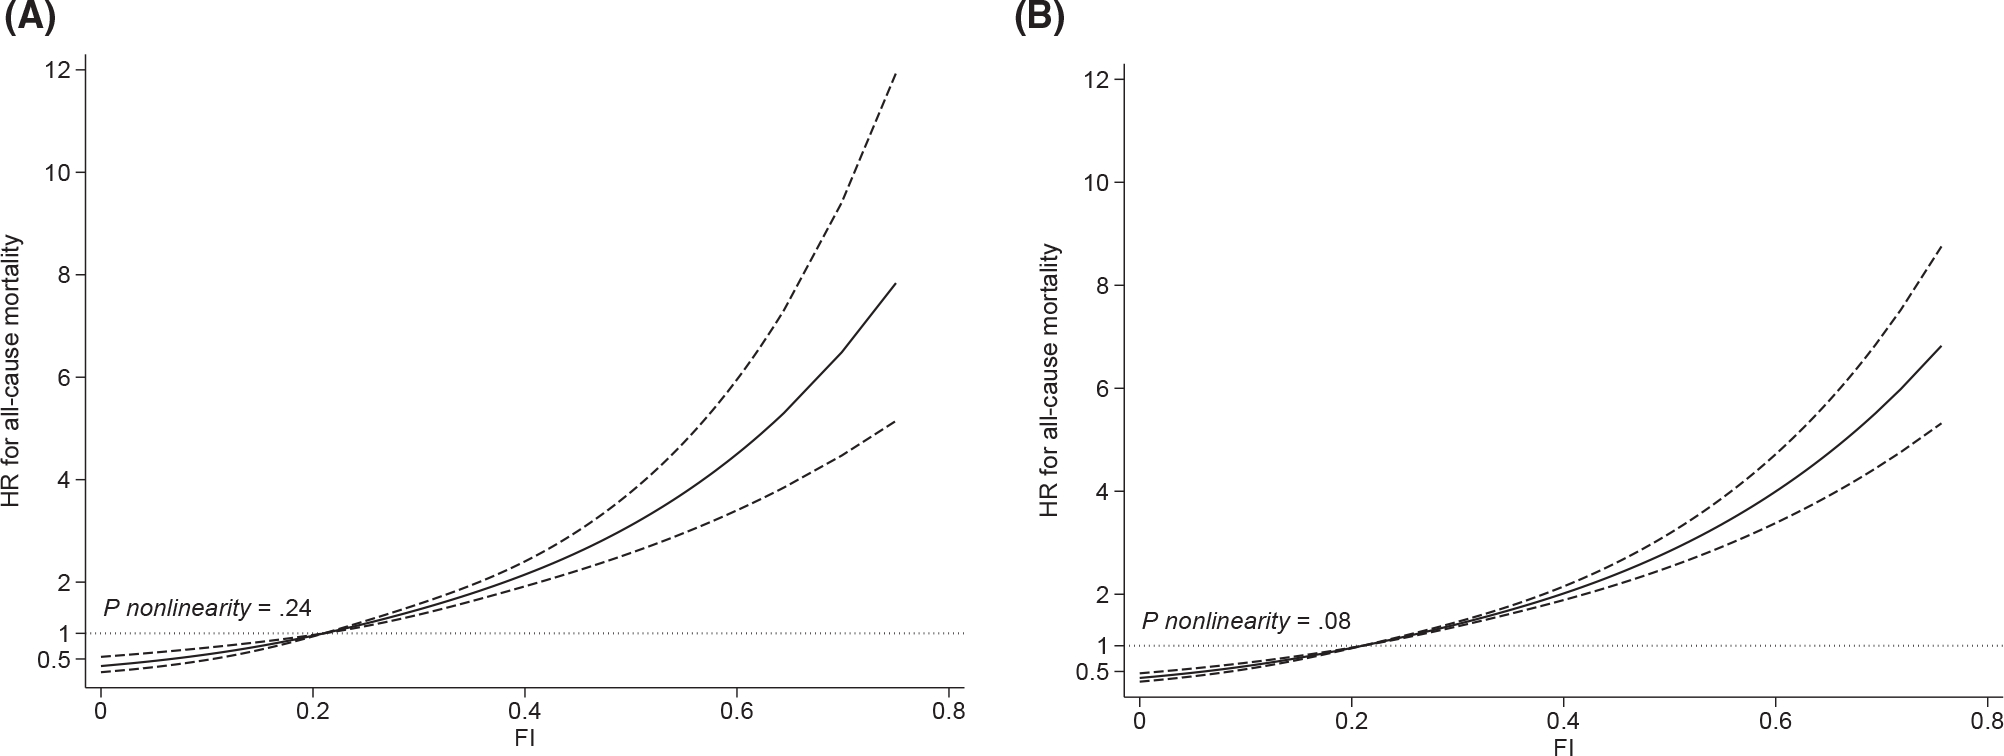
Figure 2.

Restricted cubic splines depicting dose-response relationships between the FI and the risk of all-cause mortality in (A) older cancer survivors and (B) older adults without a cancer history. The model adjusted for the following: age, sex, race, education, marital status, body mass index, smoking, alcohol drinking, protein and energy consumption, age at cancer diagnosis (for cancer survivors), history of more than 1 cancer (for cancer survivors), and survey year. The solid lines are fitted lines, the dashed lines are the 95% confidence intervals, and the dotted lines are the reference lines. FI = 0.21 is the reference in the curve. FI indicates frailty index; HR, hazard ratio
