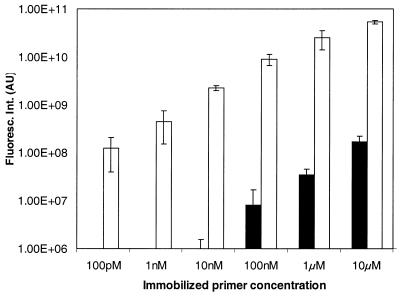
Figure 4.
Comparison of RCA amplification and hybridization sensitivities on gel-coated arrays. RCA primers were immobilized on gel-coated arrays in a 10-fold dilution series in the concentration range 10 µM–100 pM, in 0.2 µl spots. RCA was performed as described and images were quantitated with GenePix 4.0 image quantitation software. The total fluorescence intensity values for RCA (open bars) and hybridization (filled bars) are plotted against the primer concentration in the spot. Average background was subtracted from each data point. Error bars indicate the standard deviations from the means of three spots.

