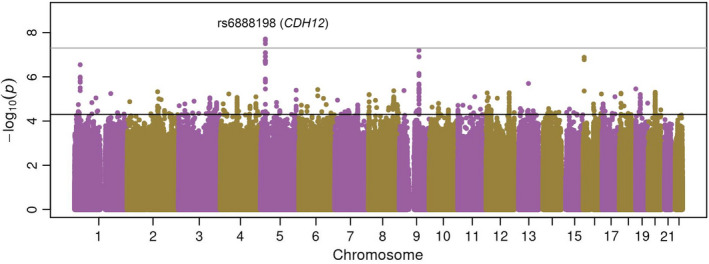
FIGURE 1.

Manhattan plot of the results of the discovery stage of the multi‐ancestry meta‐analysis of GWAS of asthma exacerbations (represented as ‐log10 p‐value on the y‐axis) along the chromosome position of the variants analyzed (x‐axis). The suggestive (p = 5 × 10⁻⁵) and genome‐wide (p = 5 × 10⁻⁸) significance thresholds are indicated by the black line and dark gray lines
