. 2022 Oct 28;14(44):16467–16478. doi: 10.1039/d2nr03664a

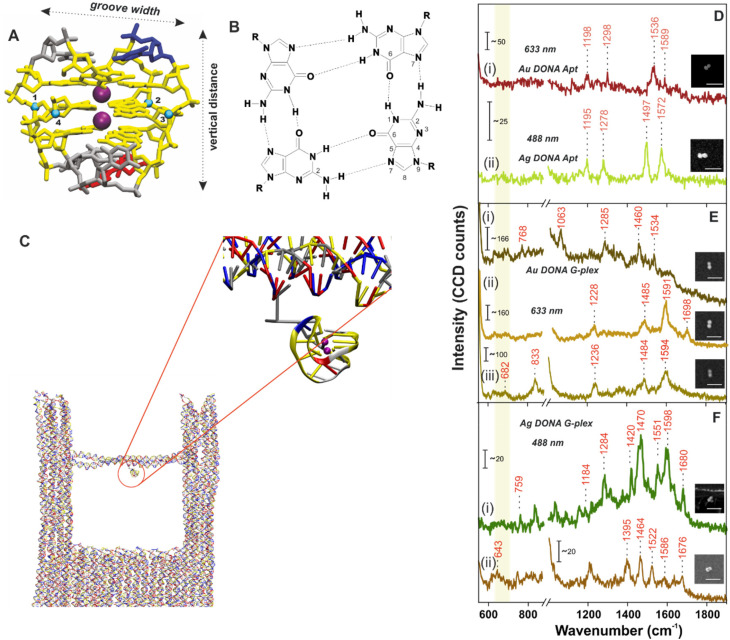
Fig. 2. (A) Atomistic model of the G-quadruplex structure. The colour coding matches the one in Fig. 1. (B) Cross sectional view of the guanine tetrad showing the Hoogsteen type H-bond interaction between dG bases. The groove width is computed considering the backbone to backbone distance between the C4′ atoms shown and numbered as blue spheres. (C) Snapshot of the G-quadruplex attached to the nanofork (encircled in red; zoomed in view) from the coarse-grained oxDNA2 molecular dynamics simulation. SM SERS spectra of (D) aptamer bound (i) Ag DONAs and (ii) Au DONAs and that after formation of G-quadruplex using (E) Au DONAs and (F) Ag DONAs. Au DONAs and Ag DONAs in all cases were measured under laser excitation of 633 nm (Obj: 100×; power: 250 μW; acc time: 4 s) and 488 nm (Obj: 100×; power: 80 μW; acc time: 4 s), respectively. Insets in (D–F) show SEM images of the respective DONAs; scale bar = 250 nm and (i), (ii) or (iii) in (E), (F) and (G) represents individual DONA spectra. The yellow vertical line highlights the ring breathing frequency region.

Fig. 2