. 2022 Oct 28;14(44):16467–16478. doi: 10.1039/d2nr03664a

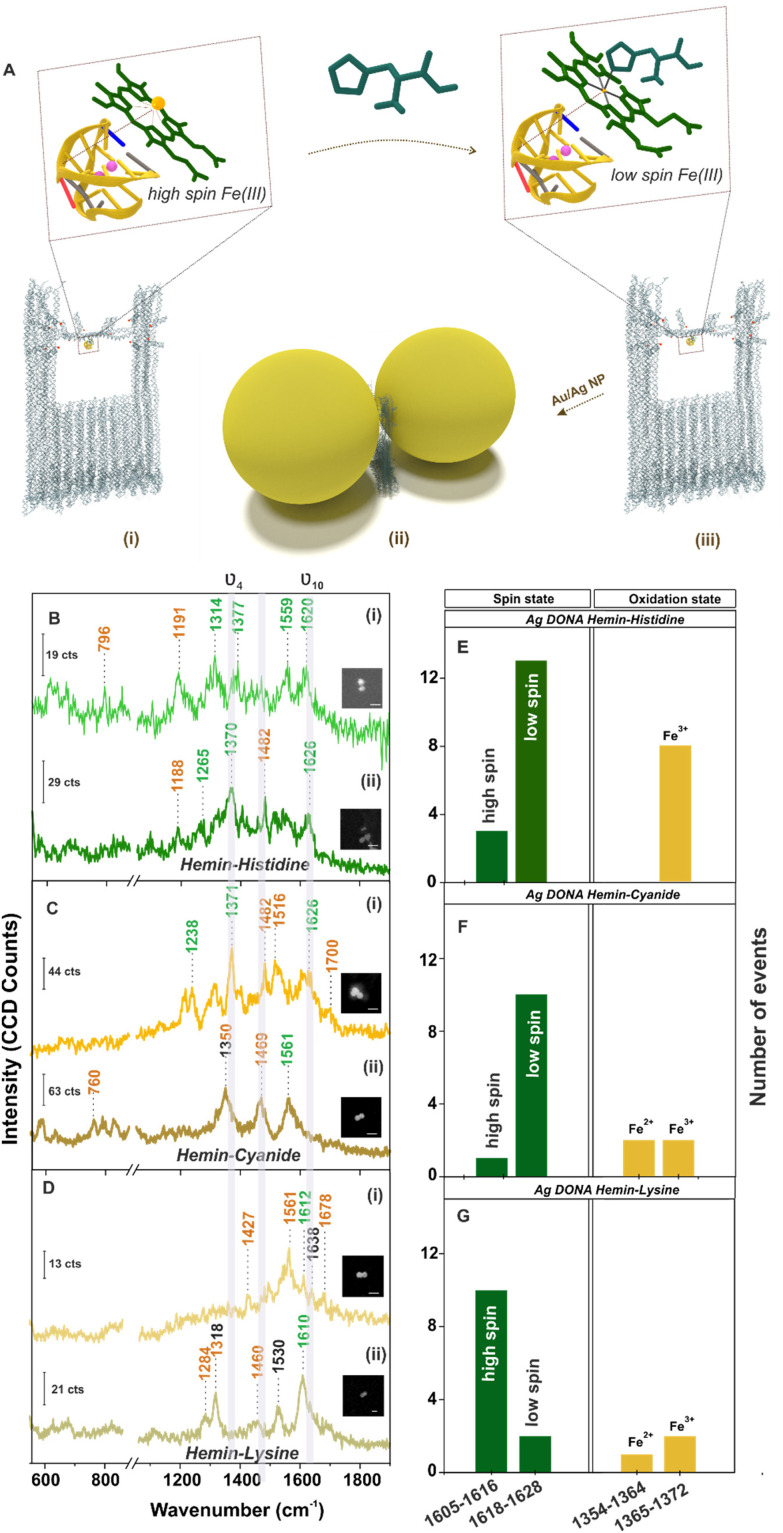
Fig. 4. (A) Schematic representation of spin cross-over in hemin. Hemin bound to G-quadruplex in (i) high spin and (ii) low spin configuration – upon ligand binding (shown for histidine as an example) in the DNA origami nanofork bridge, (iii) nanoparticles (Au/Ag) coated with differently functionalised DNA sequence hybridised with complementary DNA capture strand (end labelled with red spheres) hanging out from the upper arms and bridge position of the DNA origami nanofork to form DONAs. Brown box indicates the plasmonic hot-spot of DONAs with G-quadruplex–hemin–ligand complex trapped therein. SERS spectra (inset shows SEM image of the corresponding DONAs; scale bar = 125 nm; measurement condition – laser: 488 nm; obj: 100×; power: 250 μW; acc. time: 4 s) of hemin bound Ag DONAs upon complexation with (B) histidine, (C) cyanide and (D) lysine and their corresponding statistical distribution of spin and oxidation state (E–G), respectively. (i) and (ii) in (B), (C) and (D) represents two individual DONA spectra.

Fig. 4