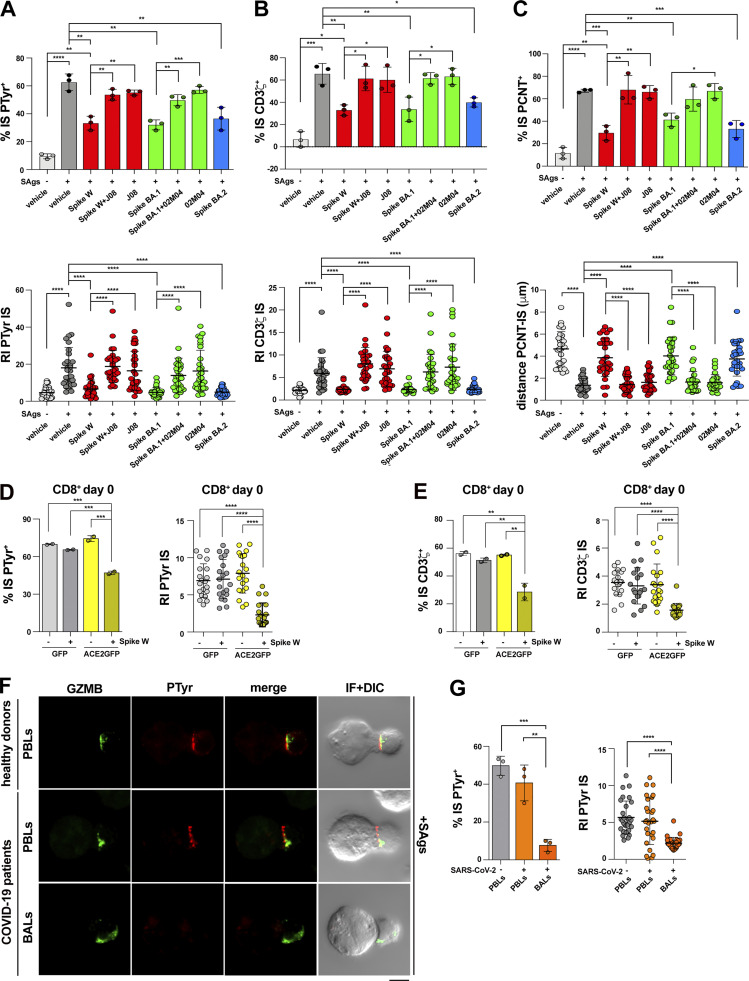
Figure 4.
The inhibitory effects of Spike on IS formation are mediated by ACE2 and can be detected in acutely infected SARS-CoV-2 patients. (A and B) Top: Quantification (%) of 15-min antigen-specific conjugates harboring PTyr (A) or CD3ζ (B) staining at the IS in CTLs (day 7) pretreated with either vehicle (PBS) or 0.05 μg/μl Spike W, Spike Omicron BA.1 (Spike BA.1), alone or in the presence of the respective neutralizing mAb (Spike W + J08; Spike BA.1 + 02M04); or Spike Omicron BA.2 (Spike BA.2). Samples pretreated with only the neutralizing mAbs (J08 and 02M04) were also included in the analysis. CTLs were mixed with Raji cells (APCs), either unpulsed or pulsed with a combination of SEA, SEB, and SEE (SAgs), and incubated for 15 min at 37°C (≥50 cells/sample, n = 3, unpaired two-tailed Student’s t test; ****, P ≤ 0.0001; ***, P ≤ 0.001; **, P ≤ 0.01; *, P ≤ 0.05). Bottom: Relative PTyr (A) or CD3ζ (B) fluorescence intensity at the IS (recruitment index; 10 cells/sample, n = 3, Kruskal–Wallis test; ****, P ≤ 0.0001). (C) Top: Quantification (%) of 15-min antigen-specific conjugates formed as in panel A harboring PCTN1 staining at the IS (≥50 cells/sample, n = 3, one-way ANOVA test; ****, P ≤ 0.0001; ***, P ≤ 0.001; **, P ≤ 0.01; *, P ≤ 0.05). Bottom: Measurement of the distance (μm) of the centrosome (PCNT) from the T cell–APC contact site (10 cells/sample, n = 3, Kruskal–Wallis test; ****, P ≤ 0.0001). (D and E) Immunofluorescence analysis of PTyr (D) and CD3ζ (E) in purified CD8+ T cells transfected with an ACE2-GFP–expressing construct or empty vector, pretreated with either vehicle (PBS) or 0.05 μg/μl Spike W, then mixed with Raji cells (APCs) either unpulsed or pulsed with a combination of SEA, SEB, and SEE (SAgs), and incubated for 15 min at 37°C. The histograms show (left) the quantification (%) of conjugates harboring PTyr (D) and CD3ζ (E) staining at the IS (top; ≥50 cells/sample, n = 2, one-way ANOVA test; ***, P ≤ 0.001; **, P ≤ 0.01), or (right) the relative PTyr (D) and CD3ζ (E) fluorescence intensity at the IS (recruitment index; 10 cells/sample, n = 2, Kruskal–Wallis test; ****, P ≤ 0.0001). Quantification was carried out on GFP+ cells. (F) Immunofluorescence analysis of PTyr and GrzB in BALs or PBLs from patients with acute SARS-CoV-2 infection, or PBLs from healthy donors, mixed with Raji cells (APCs) pulsed with a combination of SEA, SEB, and SEE (SAgs), and incubated for 15 min at 37°C. Representative images (medial optical sections) of the T cell:APC conjugates are shown. (G) The histograms show (left) the quantification (%) of 15-min SAg-specific conjugates harboring PTyr staining at the IS (≥50 cells/sample, n = 3, one-way ANOVA test; ***, P ≤ 0.001; **, P ≤ 0.01), or (right) the relative PTyr fluorescence intensity at the IS (recruitment index; 10 cells/sample, n = 3, Kruskal–Wallis test; ****, P ≤ 0.0001). The analysis was restricted to CTLs, identified by GrzB staining. Data are expressed as mean ± SD. Nonsignificant differences are not shown. Scale bar, 5 μm.

