Figure S1.
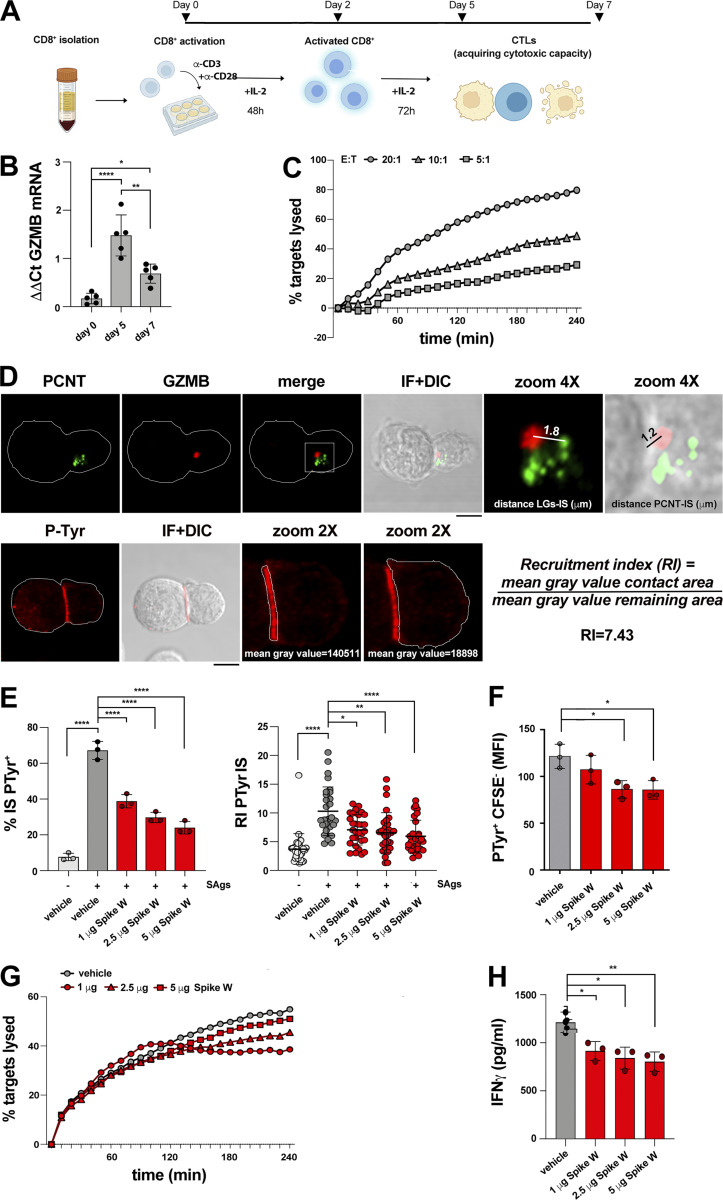
Experimental settings used. (A) Workflow for CTL generation from CD8+ T cells purified from buffy coats of healthy donors. (B) RT-qPCR of human GzmB mRNA in purified CD8+ T cells at days 0, 5, and 7 after stimulation with anti-CD3/CD28 mAb–coated beads in the presence of IL-2 (n = 5, one-way ANOVA test; ****, P ≤ 0.0001; **, P ≤ 0.01; *, P ≤ 0.05). (C) Fluorimetric analysis of cytotoxicity of CTLs (day 7) generated as depicted in A, using the real-time calcein release–based killing assay. The killing process was monitored in different CTL:target cell ratios over time by measuring the release of calcein fluorescence every 10 min for 4 h. Representative curves showing the kinetics of target cell lysis by CTLs at the indicated CTL:target cell ratios are shown (n = 3). (D) Top: Image of a representative CD8+ T cell (day 7) conjugated with SAg-pulsed Raji B cells for 15 min and co-stained with anti-PCNT and anti-GzmB Abs. The CD8+ T cell was magnified to depict the parameters used for quantification in Figs. 3, 4, and 5; and Figs. S2 and S3. A line from the center of each LG (marked by GzmB) to the center of the centrosome (marked by PCNT) was drawn to measure the distance (μm) between LGs and centrosome. A line from the center of the centrosome (marked by PCNT) of the CD8+ T cell to the center of the contact area with the Raji cell was drawn to measure the distance (μm) between the centrosome and the T cell:APC contact area. Bottom: Image of a representative CD8+ T cell (day 7) conjugated with SAg-pulsed Raji B cells for 15 min and stained with anti-PTyr mAb. The T cell was magnified to depict the parameters used for quantification in Figs. 1, 2, 4, and 5; and Figs. S2 and S3. Masks around both the contact area of CD8+ T cell:APC and in the remaining CD8+ T cell area were drawn to measure the mean gray value. The recruitment index (RI) was calculated as specified. (E) Immunofluorescence analysis of PTyr in CTLs (day 7) pretreated with either vehicle (PBS) or different concentrations of Spike W, then mixed with Raji cells (APCs) either unpulsed or pulsed with a combination of SEA, SEB, and SEE (SAgs), and incubated for 15 min at 37°C. Left: Quantification (%) of conjugates harboring PTyr staining at the IS (100 cells/sample, n = 3, one-way ANOVA test; ****, P ≤ 0.0001). Right: Relative PTyr fluorescence intensity at the IS (10 cells/sample, n = 3, Kruskal–Wallis test; ****, P ≤ 0.0001; **, P ≤ 0.01; *, P ≤ 0.05). (F) Flow cytometric analysis of conjugates prepared as in E. Raji cells were loaded with 5 μM CFSE prior to conjugate formation. Conjugates were stained anti-PTyr mAb followed by fluorescently labeled secondary Abs. The analysis was carried out gating on CSFE− cells (n = 3, one-way ANOVA test; *, P ≤ 0.05). (G) Fluorimetric analysis of cytotoxicity of CTLs (day 7) using the calcein release assay. CTLs were pretreated with either vehicle (PBS) or different concentrations of Spike W and co-cultured with SAg-pulsed, calcein AM–loaded Raji cells at a E:T cell ratio 10:1 for 4 h. The representative curves show the kinetics of target cell lysis by CTLs at the different concentrations of Spike W (n = 3). (H) ELISA-based quantification of IFNγ in 36-h supernatants of melanoma-specific CTLs, pretreated with either vehicle (PBS) or different concentrations of Spike W and co-cultured with irradiated autologous APCs pulsed with 2 µg/ml MAGE 3 (n = 3, one-way ANOVA test; **, P ≤ 0.01; *, P ≤ 0.05). Data are expressed as mean ± SD. Nonsignificant differences are not shown. Scale bar, 5 μm.

