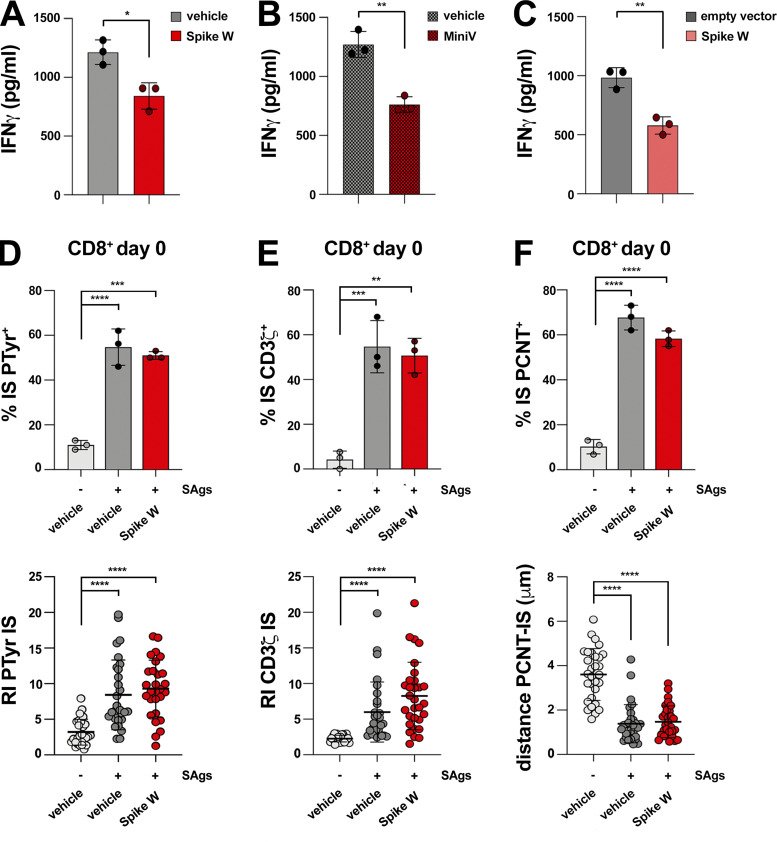
Figure S2.
Spike suppresses IS assembly and function in CTLs but not in resting CD8+ T cells. (A and B) ELISA-based quantification of IFNγ in 36-h supernatants of melanoma-specific CTLs derived from three patients, pretreated with either vehicle (PBS) or Spike W (A), or with 1.2 × 10⁹ liposomes or MiniVs (B), and co-cultured with irradiated autologous APCs pulsed with 2 µg/ml MAGE 3 (n = 3, unpaired two-tailed Student’s t test; **, P ≤ 0.01; *, P ≤ 0.05). (C) ELISA-based quantification of IFNγ in 36-h supernatants of melanoma-specific CTLs derived from three patients, co-cultured with A375 melanoma cells transiently transfected with either a construct encoding Spike W or the empty control vector (n = 3, unpaired two-tailed Student’s t test; **, P ≤ 0.01). (D–F) Top: Immunofluorescence analysis of PTyr in freshly purified CD8+ T cells (day 0) pretreated with either vehicle (PBS) or 0.05 μg/μl Spike W, then mixed with Raji cells (APCs) either unpulsed or pulsed with a combination of SEA, SEB, and SEE (SAgs), and incubated for 15 min at 37°C. The histograms show the quantification (%) of conjugates harboring PTyr (D), CD3ζ (E), or PCNT (F) staining at the IS (≥50 cells/sample, n = 3, one-way ANOVA test; ****, P ≤ 0.0001; ***, P ≤ 0.001; **, P ≤ 0.01). Bottom: Relative PTyr (D) and CD3ζ (E) fluorescence intensity at the IS (recruitment index; 10 cells/sample, n = 3, Kruskal–Wallis test; ****, P ≤ 0.0001). Measurement of the distance (μm) of the centrosome (PCNT) from the T cell–APC contact site (F; 10 cells/sample, n = 3, Kruskal–Wallis test; ****, P ≤ 0.0001). The data are expressed as mean ± SD.

