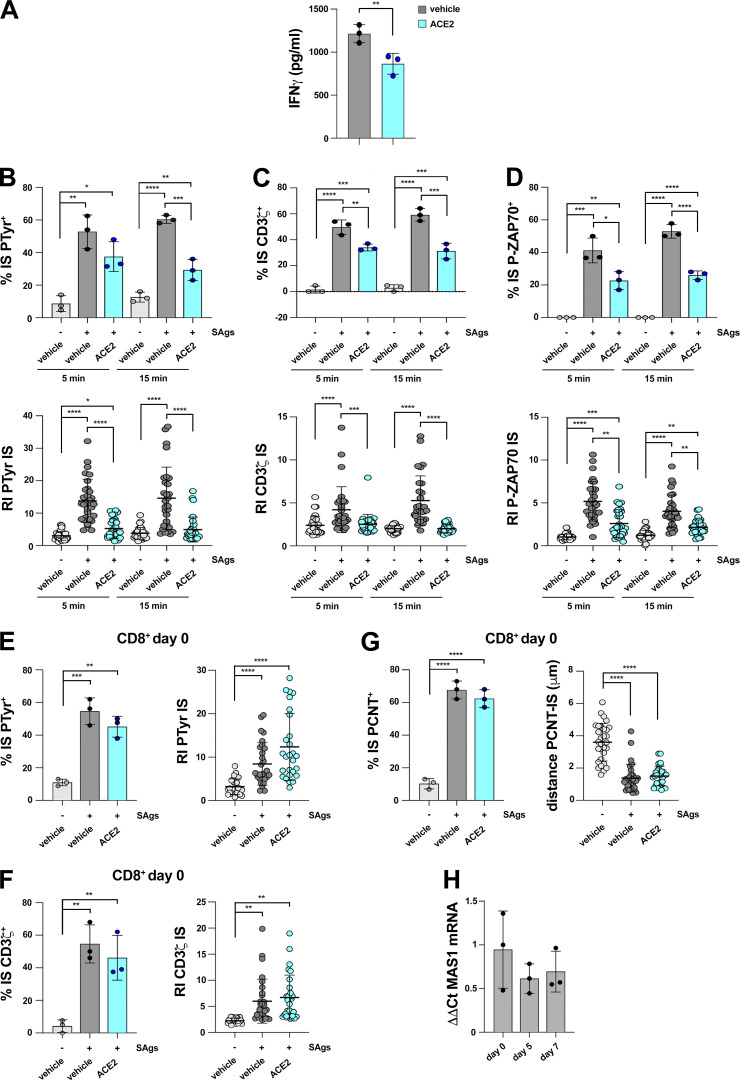
Figure S3.
ACE2 suppresses IS assembly and function in CTLs but not in resting CD8+ T cells. (A) ELISA-based quantification of IFNγ in 36-h supernatants of melanoma-specific CTLs derived from three patients, pretreated with either vehicle (PBS) or 2 μg/ml anti-ACE2 Ab (ACE2), and co-cultured with irradiated autologous APCs pulsed with 2 µg/ml MAGE 3 (n = 3, unpaired two-tailed Student’s t test; **, P ≤ 0.01). (B–D) Top: Quantification (%) of 5-min and 15-min conjugates harboring PTyr (B), CD3ζ (C), or P-ZAP-70 (D) staining at the IS (≥50 cells/sample, n = 3, one-way ANOVA test; ****, P ≤ 0.0001; ***, P ≤ 0.001; **, P ≤ 0.01; *, P ≤ 0.05). CTLs (day 7), pretreated with vehicle (PBS) or 2 μg/ml anti-ACE2 Ab (ACE2), were conjugated with Raji cells (APCs) in the absence or presence of SAgs and either an anti-ACE2 Ab, or Ang II, or the peptide Ang 1-7 (≥50 cells/sample, n = 3, one-way ANOVA test). Bottom: Relative PTyr (B), CD3ζ (C), or ZAP-70 (D) fluorescence intensity at the IS (recruitment index; 10 cells/sample, n = 3, Kruskal–Wallis test; ****, P ≤ 0.0001; ***, P ≤ 0.001; **, P ≤ 0.01; *, P ≤ 0.05). (E and F) Immunofluorescence analysis of PTyr and CD3ζ in freshly purified CD8+ T cells (day 0) pretreated with either vehicle (PBS) or 2 μg/ml anti-ACE2 Ab (ACE2), then mixed with Raji cells (APCs) either unpulsed or pulsed with a combination of SEA, SEB, and SEE (SAgs), and incubated for 15 min at 37°C. Left: Quantification (%) of conjugates harboring PTyr (E), CD3ζ (F; ≥50 cells/sample, n = 3, one-way ANOVA test; ***, P ≤ 0.001; **, P ≤ 0.01). Right: Relative PTyr (E) and CD3ζ (F) fluorescence intensity at the IS (recruitment index; 10 cells/sample, n = 3, Kruskal–Wallis test; ****, P ≤ 0.0001; **, P ≤ 0.01). (G) Immunofluorescence analysis of PCNT in conjugates formed as described in E and F. Left: Quantification (%) of conjugates harboring PCNT at the IS (≥50 cells/sample, n = 3, one-way ANOVA test; ****, P ≤ 0.0001). Right: Measurement of the distance (μm) of the centrosome (PCNT) from the T cell–APC contact site (10 cells/sample, n = 3, Kruskal–Wallis test; ****, P ≤ 0.0001). (H) RT-qPCR of human MAS1 mRNA in purified CD8+ T cells at days 0, 5, and 7 after stimulation with anti-CD3/CD28 mAb-coated beads in the presence of IL-2 (n = 3). Nonsignificant differences are not shown.

