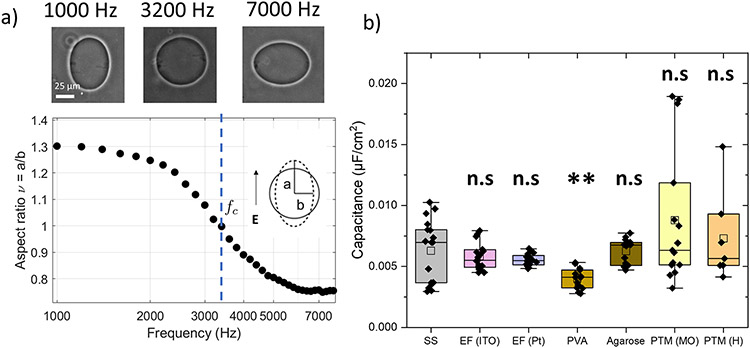
Figure 5:
a) Typical plot of membrane morphology in presence of AC electric field at different frequency at 8 kV/m and inner conductivity 40 muS/cm and outer conductivity 60-80 μS/cm. b) The box-plot represents the standardized distribution of membrane capacitance based on five numbers minimum value, first quartile (Q1), mean, third quartile (Q3), and maximum value. The abbreviations in the figure are as follows, SS: spontaneous swelling, EF: electroformation, PVA: polyvinyl alcohol, PTM (MO): phase-transfer method (mineral oil) and PTM (H): phase-transfer method (hexadecane). The open square represents the mean value. ANOVA comparisons test compared to spontaneous swelling which is set as control. n>10 vesicles were probed, ***p≤0.001, **p≤0.01, n.s p > 0.05.

