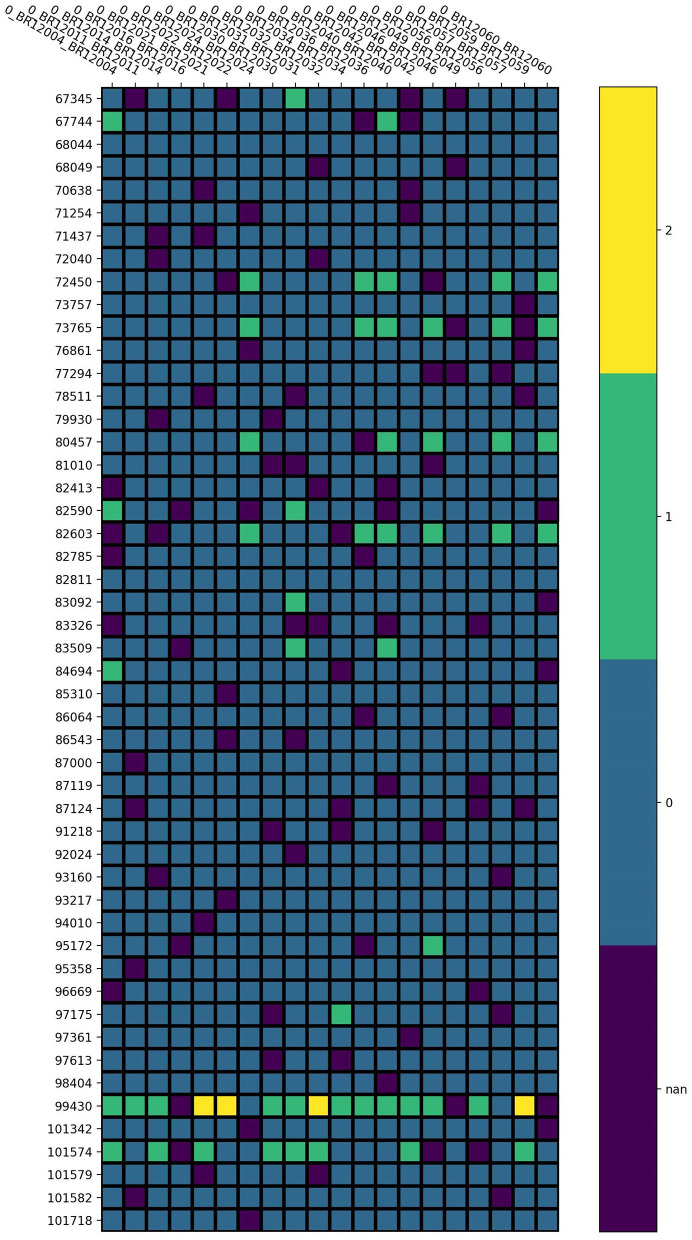
Figure 2.
Visualization of the preprocessed LOS data (chromosome 20) with a heatmap at the missing ratio of 10%. Rows represent the position of each SNP and columns indicate different samples. Different colors represent different genotype values: purple for missing value, blue for 0, green for 1, and yellow for 2.

