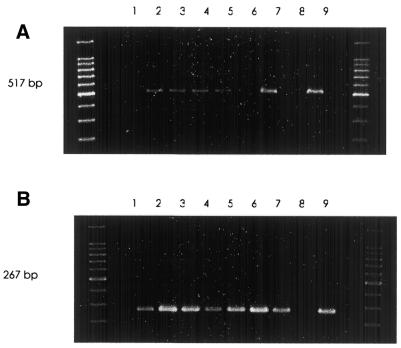
Figure 2.
Gel image data of PCR amplifications. Outer lanes contain 100 bp ladders. Reactions 1–9 according to the matrix (Table 2) are labelled accordingly. Set A represents reactions in which wild-type template DNA was the substrate. Set B represents reactions in which HbS/S template DNA was included. The 517 and 267 bp allele-specific fragments were generated in each set, respectively. Product yield varied across each reaction set. Table 3 represents maximal optical density (OD) of the amplicon bands, used as a representation of product yield/reaction score.

