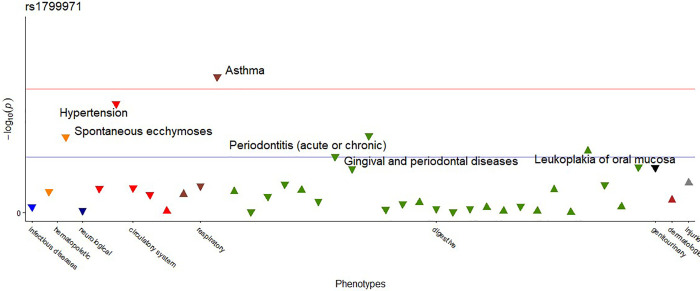
Fig 3. PheWAS result for SNP rs1799971 performed with the total sample.
The blue line indicates p-value <0.05. The horizontal red line indicates the threshold of p < 0.002. The tip direction of the triangles represents the direction of the odds ratio of each association, the upward triangles indicate odds ratio≥1; downward triangles indicate a protective effect (odds ratio<1.0). The different colors of the triangles indicate different disease groups.

